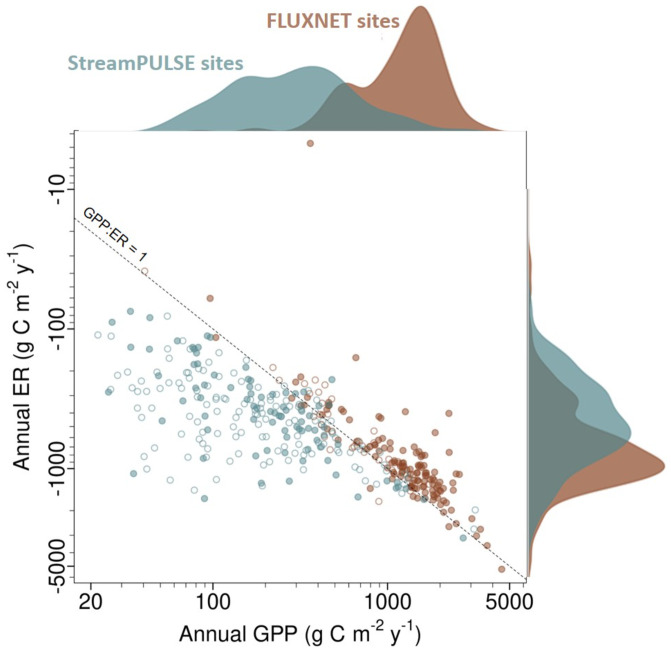
Fig. 1.
Annual rates of GPP and ER for 222 river and 162 terrestrial ecosystems are shown as a scatterplot relative to the 1:1 line of balanced aerobic ecosystem carbon production and consumption. The frequency distribution of GPP and ER values within each dataset is shown above and to the right of the scatterplot, with values aligned to the corresponding axis. Open circles indicate sites with at least 60% of all days in each year having estimated rates, and solid circles indicate sites with at least 80% of all days in each year having estimated rates. We show average annual values for sites with multiple years.

