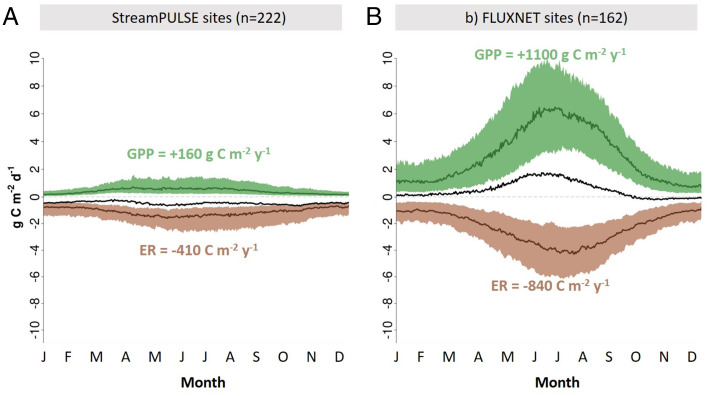
Fig. 2.
A comparison of river and terrestrial ecosystem metabolism. The median daily rates of GPP (green), ER (brown), and NEP (black) are shown as lines for 222 StreamPULSE rivers (A) and for 162 FLUXNET terrestrial ecosystems (B). The shaded area in each plot represents the interquartile range of values of GPP (green) and ER (brown) for each day. Median NEP is calculated as the difference between the two median values for each date and is the black line. For rivers with more than 1 site year, we used their average rate for each day of the year in this data synthesis. The estimated median values of annual GPP (green text) and ER (brown text) are estimated as the cumulative sum of the median daily flux.

