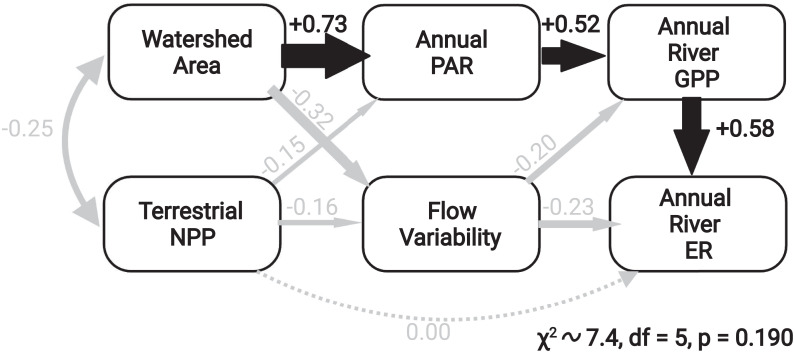
Fig. 3.
Structural equation model linking the watershed attributes (area, terrestrial NPP) and stream climate drivers (incoming photosynthetically active radiation [PAR] and flow variability) to GPP and ER across 222 rivers. The final model explained 35% of the variation in GPP and 47% of the variation in ER across sites. In this depiction, the size of the arrows is scaled to the standardized coefficients written alongside each arrow. Solid lines indicate statistically significant effects, while dashed lines indicate a hypothesized effect that was included in the initial model but for which there was no statistical support.

