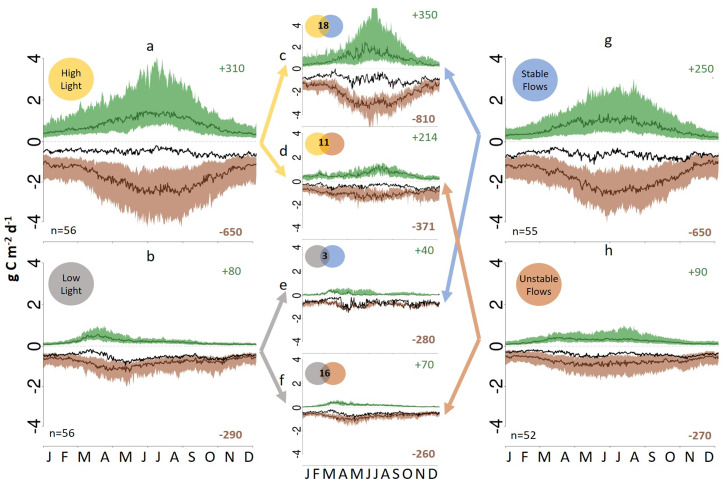
Fig. 4.
River metabolic regimes compared across light and flow regimes. A and B show the average seasonal patterns of GPP, ER, and NEP for sites in the highest quartile (A) and lowest quartile (B) of sites ranked by annual stream light. G and H show the same data for the highest quartile (G) and lowest quartile (H) of sites when ranked by flow variability (Q_skew). C–F show the average seasonal patterns of GPP, ER, and NEP for the joined subsets for sites that were in (C) the high-light, high-stability quartiles; (D) the high-light, unstable flows quartiles; (E) the low-light, stable flows quartile; and (F) the low-light, unstable flows quartiles. In each graph, the green number in the top right is the average annual GPP (grams C meter−2 year−1), and the brown number is the average annual ER (grams C meter−2 year−1) for each subsample. Larger versions of C–F are in SI Appendix, Figs. S3–S6.

