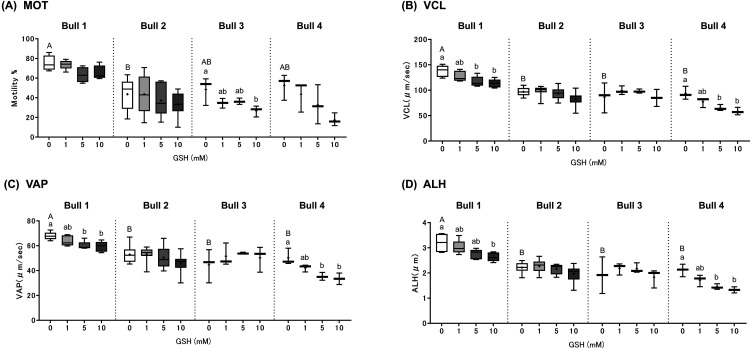
Fig. 2.
Effects of GSH supplementation on sperm motility in four bulls. Box plots represent (A) total motility (MOT, %), (B) curvilinear velocity (VCL, μm/sec), (C) average path velocity (VAP, μm/sec), and amplitude of lateral head displacement (ALH, μm) of frozen-thawed spermatozoa (n = 3–8 samples). Significant differences (P < 0.05) are represented by small letters (a, b) for differences among GSH concentrations for each bull and capital letters (A, B) for differences among bulls in the 0 mM GSH control group.

