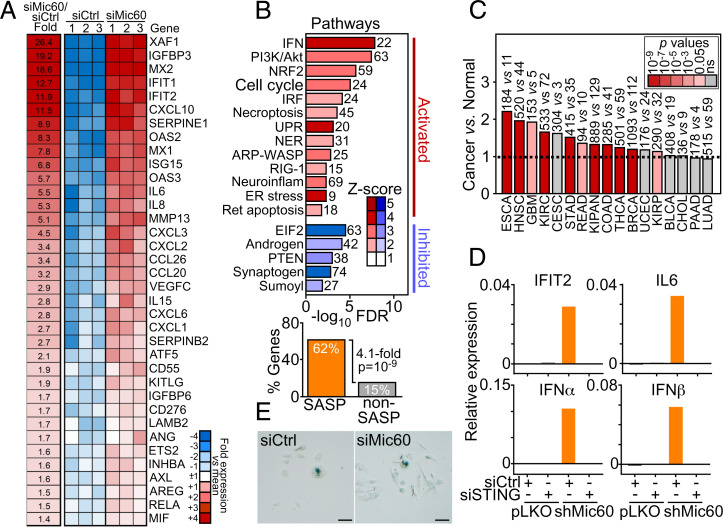
Fig. 3.
A Mic60 transcriptome in cancer. (A) PC3 cells transfected with siCtrl or siMic60 were analyzed by RNA-Seq, and relative fold changes in gene expression (false discovery rate [FDR] < 5%) were visualized in a heatmap. (B) Enrichment analysis of genes significantly different (FDR < 5%) between siCtrl and siMic60 from RNA-Seq results. Ingenuity pathway analysis (Top, canonical pathways) of pathways activated or inhibited after Mic60 knockdown. The number of genes affected and activation Z-scores are indicated. The Fisher exact test was used to test the significance of the enrichment of the SASP-like gene group, and the P value with fold enrichment of SASP-like vs. non-SASP gene products among the list of significant genes is shown. (Bottom) (C) The complete Mic60 transcriptome comprising 52 IFN/SASP-like genes was averaged across all TCGA tumors, and average levels were examined for differential expression in cancer vs. normal samples (ratio). The number of tumor and normal tissue samples is indicated per each condition. The broken line indicates ratio of 1, and the color scale indicates significance by P value. (D) PC3 cells transduced with pLKO or shMic60 were transfected with siCtrl or STING-directed siRNA (siSTING) and analyzed for the expression of representative genes in the Mic60 transcriptome by RT-PCR. Representative experiment is shown (n = 2). (E) PC3 cells as in A were analyzed for β-galactosidase staining and light microscopy (representative images). Scale bars, 100 μm.

