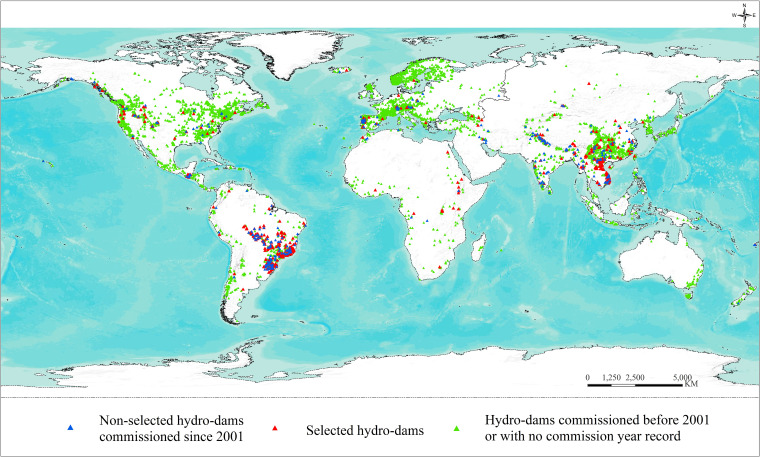
Fig. 1.
Distribution of global hydropower dams. Data are based on WRI’s Global Database of Power Plants (4). Note that the geographic focus of hydropower dam construction has shifted from North America and Europe to Asia and South America over the past two decades. Out of 7,155 global hydropower dams, 87% (6,200 green triangles) were built before 2001 (or without the commission year recorded), with 64% of these built in North America and Europe; 13% (955 blue and red triangles) were built since 2001, with 81% of these built in Asia and South America. We selected 631 dams constructed after 2001 and commissioned no later than 2015 for our current study (red triangles).

