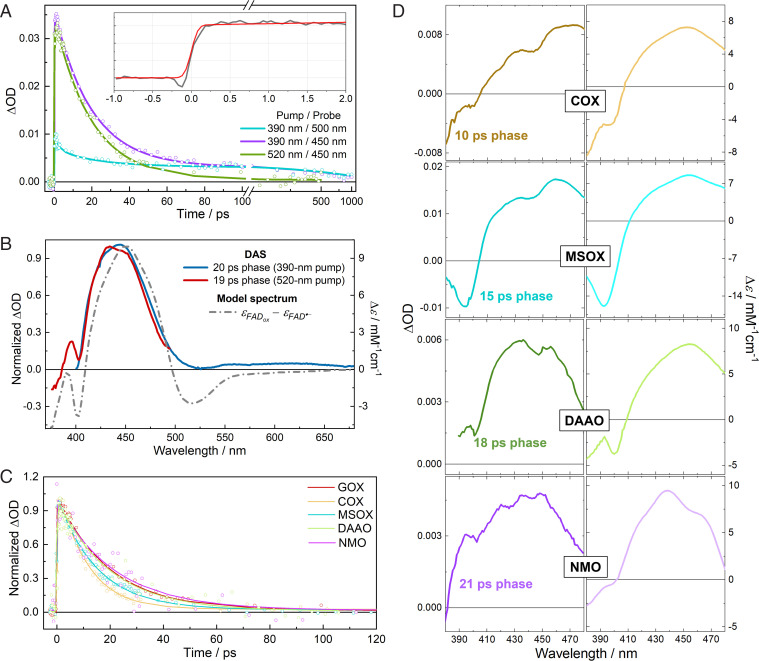
Fig. 3.
Transient absorption measurements. (A) Isotropic transient absorption kinetics of FAD•− in GOX at selected wavelengths upon excitation at 390 nm or 520 nm. Inset, rise of the induced absorption signal (gray) at 433 nm (at the minimum of the probe dispersion curve) under 390-nm excitation. The red curve represents an instrument response–limited rise. Full spectro-temporal data are depicted in SI Appendix, Figs. S13 and S14; ΔOD, change in optical density. (B) Spectral analysis of DAS of FAD•− in GOX under two excitation conditions. The model spectrum was constructed from steady-state spectra by assuming complete FAD•− to FADox conversion. (C) Isotropic transient absorption kinetics in different flavoprotein oxidases after excitation at 520 nm and monitored at 455 nm. (D) DAS of anionic flavin radicals in COX, MSOX, DAAO, and NMO under excitation at 520 nm as well as the corresponding steady-state difference spectra.

