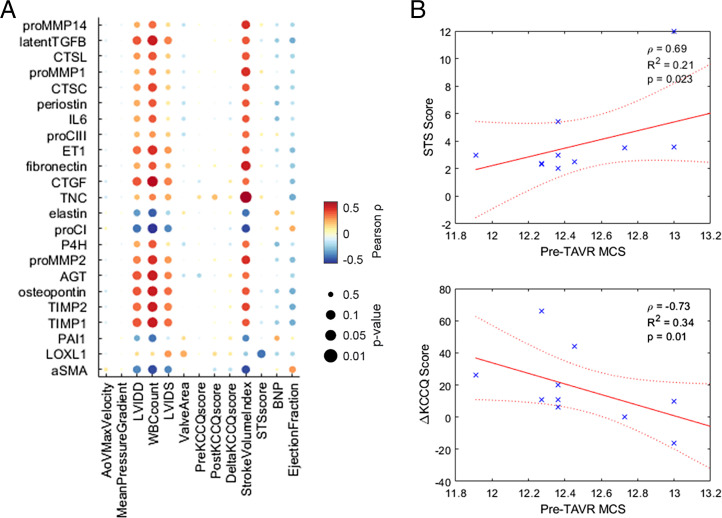
Fig. 2.
Model-predicted protein expression correlates with clinical measures of disease severity. (A) Correlation analysis of pre-TAVR output node activity levels (rows) with clinical features measured before and after TAVR surgery (columns). All dots represent Pearson correlation coefficients and respective P values. (B) Notable correlations between aggregated MCS and clinical features. Spearman correlation coefficients (ρ) and P values were used to determine significance. Stars represent each patient's data point, solid line represents linear correlation fit, and dotted lines denote confidence intervals.

