Fig. 1.
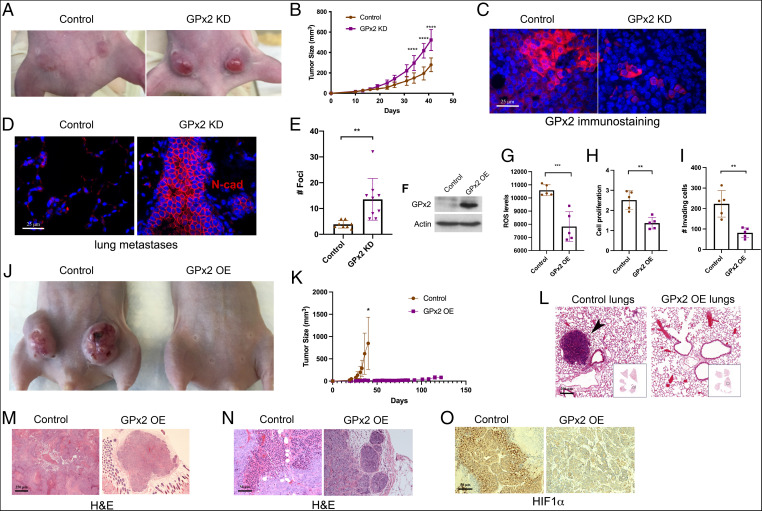
Opposing effects of GPx2 loss- and gain-of-function on mammary tumor growth and metastasis. (A) Control PyMT1 and PyMT1/GPx2 KD (sh3) cell lines (1 × 10⁶) were bilaterally injected into mammary fat pads of female athymic nude mice (n = 5). A representative mouse of each group is shown. (B) Tumor growth over 42 d posttumor onset is shown as tumor volume; mean ± SEM; ****P < 0.0001. (C) Control and GPx2 KD tumors (n = 10; 2 tumors per mouse) were immunostained for GPx2. Representative images are shown. (D) End point spontaneous lung metastasis was assessed by counting tumor foci in H&E-stained lungs and confirmed by N-cadherin immunostaining. (E) The number and distribution of lung foci generated by PyMT1/GPx2 KD versus PyMT1 control cell lines is shown as mean ± SEM; **P < 0.01. (F) PyMT2 cells were transduced with control vector or mouse GPx2 lentiviral vector. Cells were immunoblotted for GPx2 and actin, or (G) tested for ROS levels in control PyMT2 and PyMT2/GPx2 OE cells using H2DCFDA fluorescence (mean ± SEM; ***P < 0.001), or (H) tested for cell proliferation at 24 h postplating using the WST-1 assay readout (450 nm) (mean ± SEM; **P < 0.01), or (I) assayed for invasion in Matrigel-coated transwells (mean ± SEM; **P < 0.01). (J) PyMT2 control and GPx2 OE cells were bilaterally injected into mammary fat pads of female athymic nude mice (PyMT2; n = 4) and GPx2 OE (n = 5); representative images of tumor growth at 40 d postonset are shown. (K) Tumor growth curves over 40 d after tumor onset (control compared to GPx2 OE mice versus 125 d GPx2 OE mice only) are shown as mean ± SEM; *P < 0.05. (L) H&E-stained lung sections from scans of whole lung lobes (boxes) from mice carrying control or GPx2 OE tumors. (M and N) H&E-stained images (4× and 20× magnification) of control and GPx2 OE tumors are shown. (O) Representative HIF1α immunohistochemistry of control and GPx2 OE tumors (n = 8; 2 tumors per mouse).

