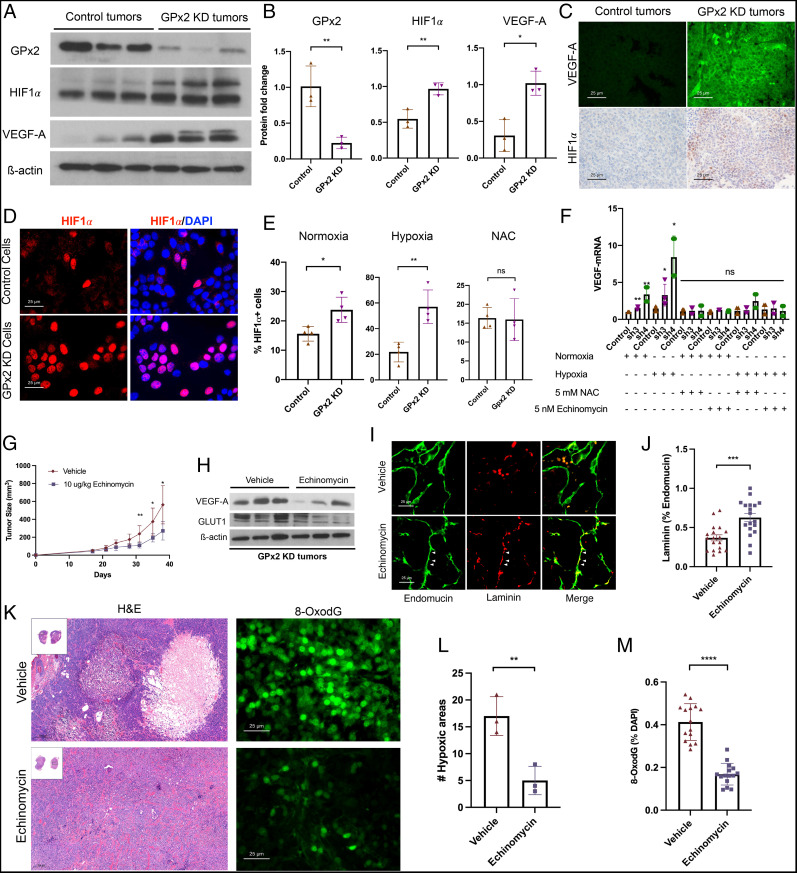
Fig. 3.
GPx2 KD stimulates ROS/HIF1α/VEGFA signaling leading to angiogenesis and tumor growth that is attenuated by HIF1α inhibition by echinomycin. (A) PyMT1 control and PyMT1/GPx2 KD tumor lysates (n = 3 from 3 independent mice) were immunoblotted with anti GPx2, VEGFA, HIF1α, or actin antibody. (B) Quantification of immunoblots of GPx2, HIF1α, VEGFA protein levels relative to actin in PyMT1/GPx2 KD relative to PyMT1 control tumors are displayed as bar graphs; mean ± SEM; *P < 0.05, **P < 0.01. (C) PyMT1 control and PyMT1/GPx2 KD tumors were immunostained with anti VEGFA (FITC) or HIF1α (DAB) antibody. (D) PyMT1 control and PyMT1/GPx2 KD cells were cultured under normoxia (20% oxygen) or hypoxia (1% oxygen) for 24 h ± 5 mM NAC, and immunostained with anti-HIF1α; representative images of cells stained under hypoxia are shown. (E) The percentage of HIF1α+ cells in PyMT1/GPx2 KD relative to PyMT1 control cells cultured under normoxia or hypoxia, was gauged by the number of HIF1α nuclear-stained cells; mean ± SEM; *P < 0.05, **P < 0.01, ns = P > 0.05. (F) PyMT1 control, PyMT1/GPx2 KD cells (sh3 and sh4) were treated with ± 5 mM NAC or 5 nM echinomycin overnight under normoxia or hypoxia; RNA from four replicas each was tested for VEGFA mRNA by qRT-PCR; mean ± SEM; **P < 0.01, *P < 0.05; ns = P > 0.05. (G) Mice bearing PyMT1/GPx2 KD tumors at 64-mm3 size (n = 6) were injected daily intraperitoneally with vehicle (DMSO) or 10 μg/kg of echinomycin/DMSO for 21 d; tumor growth curves are shown as mean ± SEM, *P < 0.05. (H) Vehicle or echinomycin-treated GPx2 KD tumors from three mice were immunoblotted for VEGFA, GLUT1, or actin. (I) Sections (12 total) from each GPx2 KD tumor treated with vehicle or echinomycin were costained for endomucin (FITC) and laminin (TRITC). (J) The fraction of vessels with laminin/endomucin colocalization (maturation) was quantified by ImageJ; mean ± SEM; ***P < 0.001. (K) Images from H&E-stained sections and 8-OxodG–stained sections from echinomycin- and vehicle-treated tumors are shown. (L and M) Quantification of three sections from three mice each per each condition shows the percentage hypoxic areas (L) and 8-OxodG+ cells (M) per section; mean ± SEM; **P < 0.01, ****P < 0.0001.

