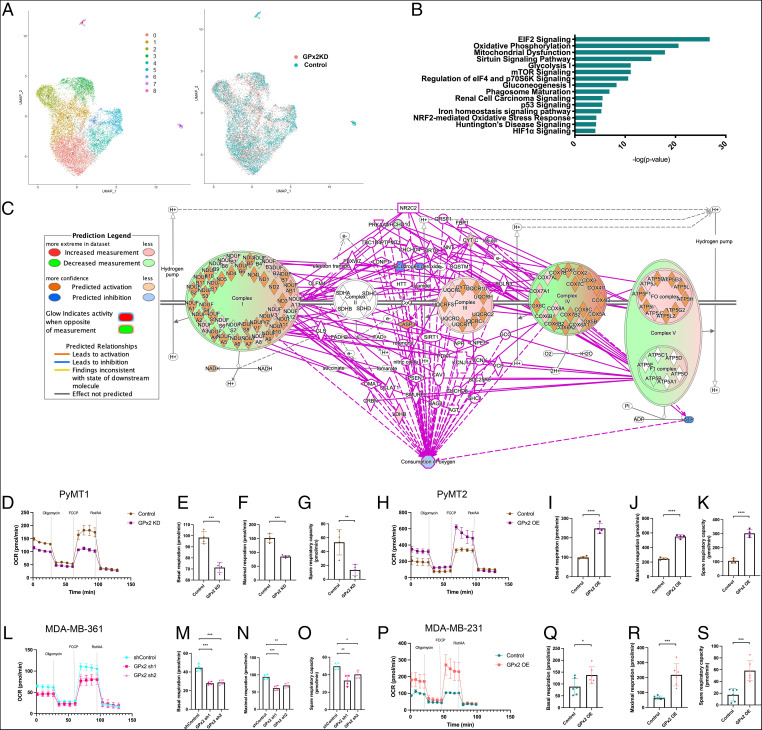
Fig. 5.
GPx2 regulates OXPHOS revealed by scRNA-seq and metabolic testing. (A) UMAP projection of comprehensively integrated clustering results from one PyMT1 control and one PyMT1/GPx2 KD tumor revealed seven epithelial clusters (cluster 0, 1, 2, 3, 4, 5, and 6) and two stromal clusters (cluster 7 and 8). UMAP shows the overlap between cell clusters of GPx2 KD (red) and control (green) tumors. (B) The genes that were differentially expressed between GPx2 KD and control tumor cells, regardless of clusters or cell states, were analyzed using IPA; over-represented signaling pathways by GPx2 KD are indicated by -log(P value). (C) Overlay of the differentially expressed genes regulated by GPx2 KD onto OXPHOS pathway in the Ingenuity Knowledge Base predicted inhibition of oxygen consumption (blue circle). (D) PyMT1/GPx2 KD and PyMT1 control cells were assayed for OCR; normalized OCR data comparing both groups were derived for each of the mitochondrial respiration steps after 1 μM oligomycin, 1 μM FCCP, and 0.5 μM rotenone/antimycin treatment. (E–G) Basal respiration, maximal respiration, and spare respiratory capacity are shown as mean of four replicas ± SEM; ***P < 0.001; **P < 0.01. (H) PyMT2/GPx2 OE cells were compared to PyMT2 control cells for OCR. (I–K) Basal respiration, maximal respiration, and spare respiratory capacity are shown as mean of four replicas ± SEM; ****P < 0.0001. (L–O) MDA-MB-361/GPx2 sh1 and GPx2 sh2 cells were compared to control cells for OCR; basal respiration, maximal respiration, and spare respiratory capacity are shown as mean of four replicas ± SEM; *P < 0.05, **P < 0.01, ***P < 0.001. (P–S) MDA-MB-231/GPx2 OE cells were compared to control cells for OCR; maximal respiration, and spare respiratory capacity are shown as mean of six replicas ± SEM; ***P < 0.001, *P < 0.05.

