Fig. 6.
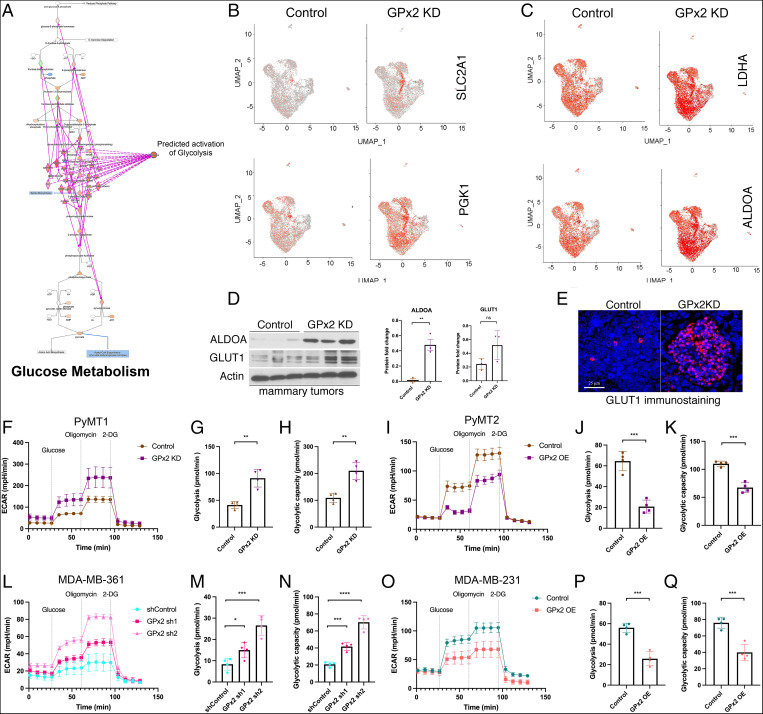
GPx2 loss stimulates glycolysis in vitro and in vivo. (A) Overlay of the differentially expressed genes regulated by GPx2 KD to glycolysis pathway in the Ingenuity Knowledge Base predicts activation of glucose metabolism. (B and C) Feature plots in low-dimensional space showed increased expression of SLC2A1, PGK1, LDHA, ALDOA glycolytic genes in the GPx2 KD relative to control tumor. (D) Western blots of ALDOA, GLUT1, and actin in PyMT1/GPx2 KD vs. control tumors. Graphs of densitometric values of ALDOA and GLUT1 immunoblots relative to actin are shown as mean ± SEM; **P < 0.01 for ALDOA. (E) PyMT1 control and PyMT1/GPx2 KD tumors (five each) were immunostained with anti-GLUT1 antibody followed by TRITC detection and DAPI counterstain; a representative image of each tumor is shown. (F) PyMT1/GPx2 KD and PyMT1 control cells were assayed for ECAR; normalized ECAR values were derived after sequential treatment with 20 mM glucose, 1 μM oligomycin, and 50 mM 2-DG; (G and H) glycolysis and glycolytic capacity are shown as mean of four replicas ± SEM; **P < 0.01. (I–K) PyMT2/GPx2 OE cells and PyMT2 control were assayed for ECAR; glycolysis and glycolytic capacity are shown as mean of four replicas ± SEM; ***P < 0.001. (L–N) MDA-MB-361/GPx2 sh1 and GPx2 sh2 cells were compared to control cells for ECAR; glycolysis and glycolytic capacity are shown as mean of four replicas ± SEM; *P < 0.05, ***P < 0.001, ****P < 0.0001. (O–Q) MDA-MB-231/GPx2 OE cells were compared to control cells for ECAR; glycolysis and glycolytic capacity are shown as mean of four replicas ± SEM; ***P < 0.001.

