Fig. 7.
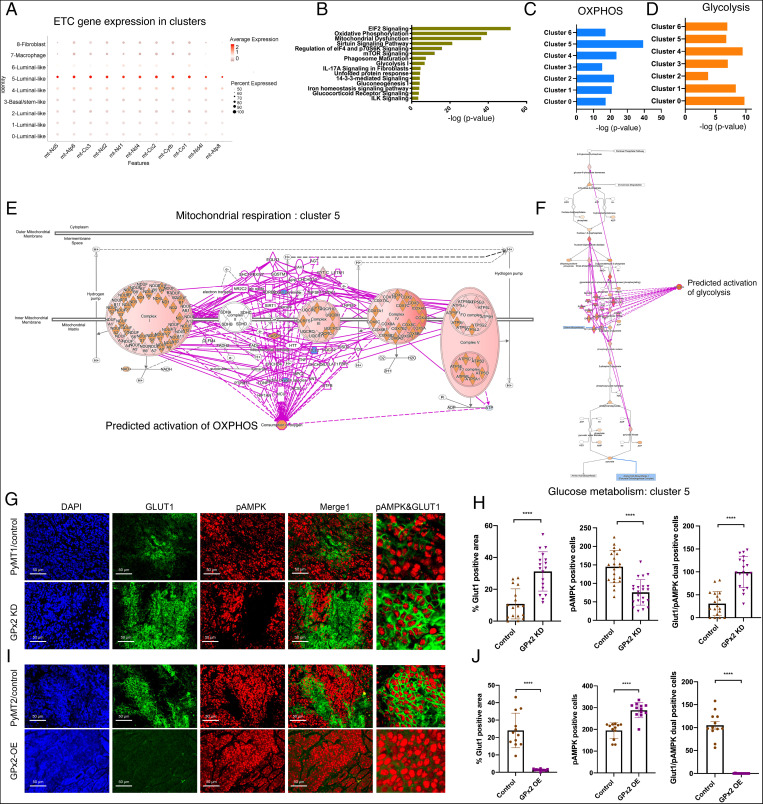
GPx2 KD stimulates a tumor cell cluster with a hybrid metabolic phenotype. (A) Dot plot of overrepresented electron transport chain (ETC) genes shows cluster 5-specific expression across nine clusters. Red dot intensity represents average expression of mRNA, and diameter of the dot refers to the percentage of cells expressing the indicated gene in the x axis. (B) Core analysis using IPA of differentially expressed genes in cluster 5 revealed over-represented pathways that were enriched by GPx2 KD. (C and D) Comparing OXPHOS and glycolysis enrichment across all clusters. (E and F) Overlay of the differentially expressed genes regulated by GPx2 KD in cluster 5 onto the OXPHOS and glycolysis pathway in the Ingenuity Knowledge Base predicted activation of both oxygen consumption/OXPHOS and glycolysis. (G and I) PyMT1 and PyMT1/GPx2 KD mammary tumors from five mice each; PyMT2 and PyMT2/GPx2 OE tumors from four mice each were sectioned and three random sections from each tumor were coimmunostained with anti GLUT1 (FITC) and p-AMPK (TRITC) antibody and counterstained with DAPI (blue); the far right panels represent blown images to highlight the pAMPK/GLUT1+ cells. (H and J) The fraction of GLUT1 positive tumor area per section was quantified by ImageJ (Left); mean ± SEM; the number of p-AMPK+ tumor cells (Center) and the number of GLUT1/p-AMPK dual positive tumor cells (Right) per section were calculated as mean ± SEM. Two-tailed t test; ****P < 0.0001.

