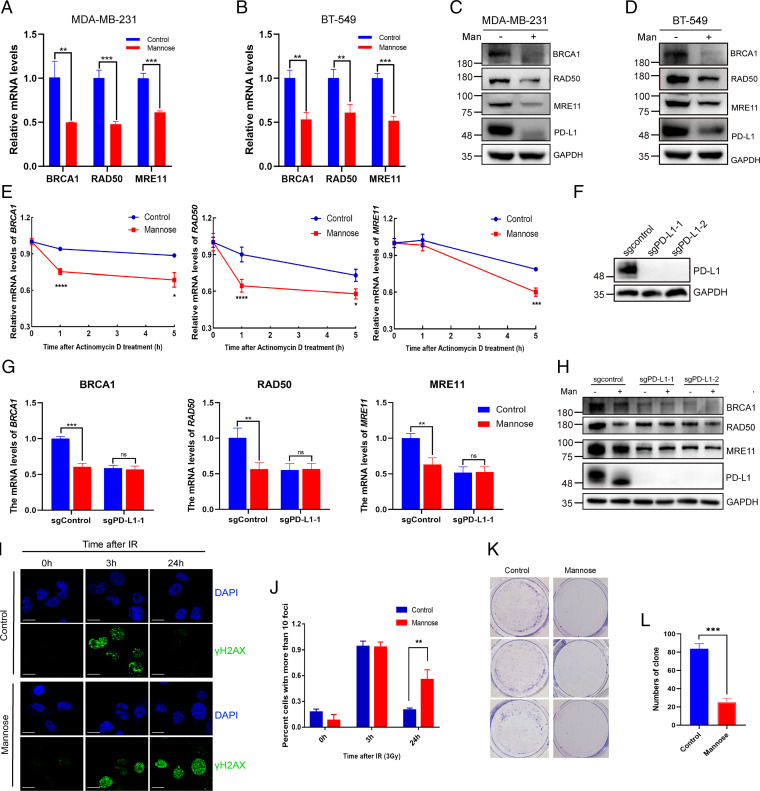
Fig. 5.
D-mannose inhibits PD-L1–mediated DDR and sensitizes TNBC cells to IR. (A and B) qRT-PCR analysis of BRCA1, RAD50, and MRE11 mRNA levels under D-mannose treatment in MDA-MB-231 cells (A) and BT-549 cells (B). Values are means ± SD from n = 3 independent experiments. Statistical differences were determined by Student’s t test. **P < 0.01, ***P < 0.001. (C and D) Western blot analysis of BRCA1, RAD50, and MRE11 levels in MDA-MB-231 cells (C) and BT-549 cells (D) treated with D-mannose. (E) qRT-PCR analysis of BRCA1, RAD50, and MRE11 mRNA levels in control and D-mannose–treated MDA-MB-231 cells after treating with the transcription inhibitor actinomycin D for different time as indicated. Values are means ± SD from n = 3 independent experiments. Statistical differences were determined by Student’s t test. *P < 0.05, ***P < 0.001, ****P < 0.0001. (F) Western blot analysis of PD-L1 in control and PD-L1 KO MDA-MB-231 cells. (G) qRT-PCR analysis of BRCA1, RAD50, and MRE11 mRNA levels in control or PD-L1 KO MDA-MB-231 cells following D-mannose treatment. Values are means ± SD from n = 3 independent experiments. Statistical differences were determined by Student’s t test. ns, no significance, **P < 0.01, ***P < 0.001. (H) Western blot analysis of BRCA1, RAD50, and MRE11 levels in control or PD-L1 KO MDA-MB-231 cells under D-mannose treatment. (I) Immunostaining of γ-H2AX in MDA-MB-231 cells with IR (3Gy) and D-mannose treatment as indicated. (J) Quantifications of images in (I). Data represent mean ± SD from three independent samples of each group. Statistical differences were determined by Student’s t test. **P < 0.01. (K) The growth of control and D-mannose–treated MDA-MB-231 cells under IR (3Gy) treatment was determined by colony formation assay. (L) Quantifications of images in (K). Data represent mean ± SD. Statistical differences were determined by Student’s t test. ***P < 0.001.

