Fig. 6.
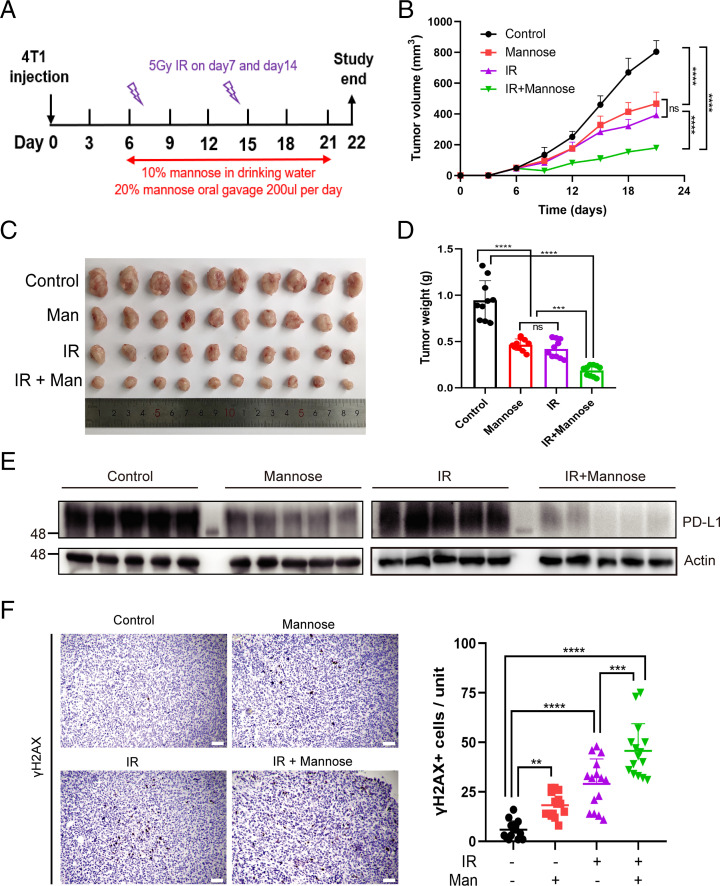
D-mannose sensitizes TNBC to radiotherapy. (A) Schematic representation of the animal experiment process. (B) Tumor growth of 4T1 cells in BALB/c mice treated with D-mannose or/and IR was determined. n = 10 mice per group. Statistical differences were determined by ordinary one-way ANOVA. ns, no significance, ****P < 0.0001. (C) Representative tumors resected from each group of mice that received different treatment as indicated. (D) The weight of tumors resected from each group of mice that received different treatment as indicated was analyzed. Data represent mean ± SD, n = 10 mice per group. Statistical differences were determined by ordinary one-way ANOVA. ns, no significance, ***P < 0.001, ****P < 0.0001. (E) Western blot analysis of PD-L1 level in 4T1 tumor tissues as indicated. (F) Left: Immunohistochemistry showing γ-H2AX expression in the 4T1 tumor tissues (Scale bars, 100 μm). Right: Quantifications of the immunohistochemistry images. Data represent mean ± SD from 15 independent samples of each group. Statistical differences were determined by ordinary one-way ANOVA. **P < 0.01, ***P < 0.001, ****P < 0.0001.

