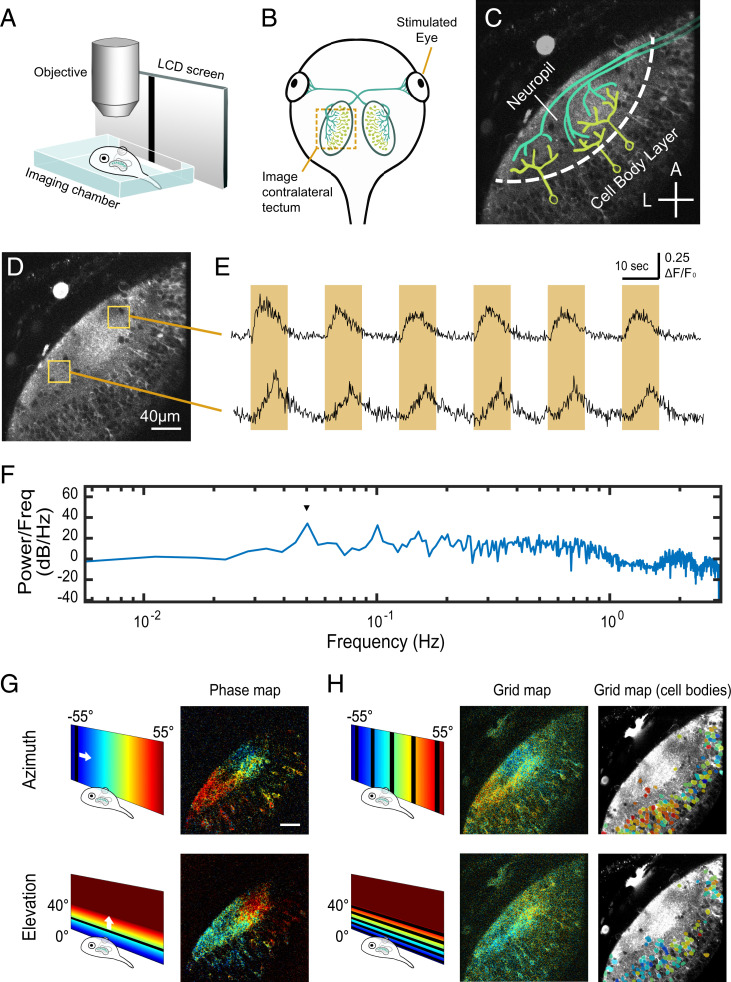
Fig. 1.
Experiment setup for visualizing retinotopic maps in the tadpole tectum. (A) Schematic of imaging setup. The tadpole was immobilized and embedded in agarose in an imaging chamber under the microscope, with one eye viewing visual stimuli on an LCD screen through a glass slide on the side of the imaging chamber. (B) Schematic of the tadpole retinotectal system. RGC axons innervate the contralateral tectum. (C) Imaging field in the tadpole tectum corresponding to the region indicated in B, showing discrete neuropil and cell body layers. RGC axons are in green, and postsynaptic tectal neurons are in yellow. A, anterior; L, lateral. (Cross bars: 40 µm.) (D) Two-photon optical section in GCaMP6s transgenic tadpole tectum. (E) Mean GCaMP6s ΔF/F0 plots from the anterior and posterior tectal ROIs in D showing responses to an anterior to posterior drifting bar stimulus. Each cycle consisted of a bar slowly traversing the monitor once over 10 s followed by 10 s blank, thus repeating every 20 s. Orange highlights indicate when the drifting bar was visible. Signal in the anterior ROI peaked at an earlier time per sweep (phase) than in the posterior ROI. (F) Fourier power spectrum of the first differential of a calcium response to 10 repeats of the drifting bar stimulus measured over the neuropil (single optical section, 6-Hz acquisition rate). A peak in power (arrowhead) occurs at the stimulus frequency (0.05 Hz). (G) Examples of retinotopic maps extracted from a stage 48 transgenic animal color coded by phase of response to drifting bar stimuli. Pixel brightness in phase maps indicates SNR. (H) “Grid maps” were obtained by flashing a bar at five locations across azimuth or elevation. (Center) Pixelwise grid maps obtained from the same animal in G color coded by optimal stimulus position. Pixel brightness reflects the maximal evoked response (ΔF/F0) divided by the mean of evoked responses to the dark bar stimuli. (Right) Cell body grid maps from the same animal. Cell body ROIs are color coded by optimal stimulus position and overlaid on a time-averaged image of the tectum. (Scale bars: 40 µm.)

