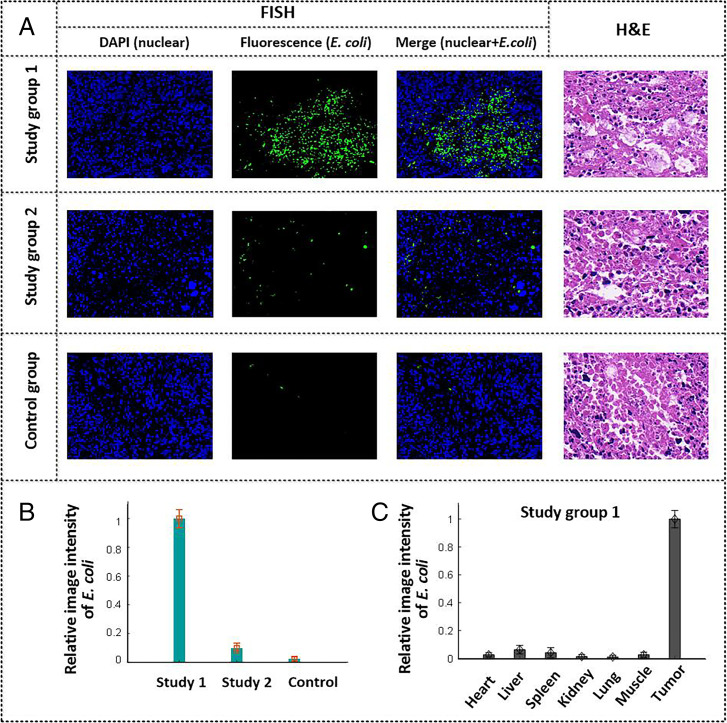
Fig. 6.
(A) Representative images of FISH (Left, Center Left, and Center Right) and H&E-stained (Right) tumor slices for both the study groups and the control group at 7 d postinjection. (Magnification:x400.) (B) Statistical analysis of the E. coli distributions for the study and control groups at tumor regions based on the FISH images. (C) Quantitative comparison of E. coli distributions in different organs for study group 1 based on the FISH images. Bars in B and C indicate the mean and standard error of the fluorescence signals in the FISH images.

