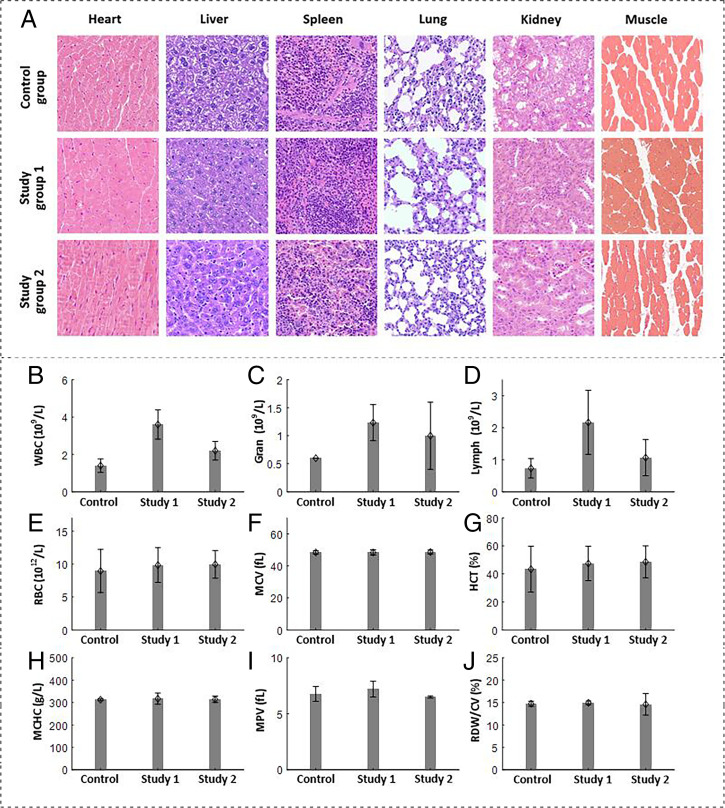
Fig. 7.
(A) Representative H&E-stained tissue images of major organs and muscle harvested from mice in the study groups and control group at 7 d after the intravenous injection of either E. coli or SPSS. (Magnification: ×400.) (B–J) Blood analysis of mice in the above three groups. Bars indicate the SD from the mean (n = 3). (B) Number of white blood cells (WBC). (C) Number of neutrophilic granulocytes (Gran), (D) Number of lymphocytes. (E) Number of red blood cells (RBC). (F) Mean corpuscular volume (MCV). (G) Hematocrit (HCT). (H) Mean corpuscular hemoglobin concentration (MCHC). (I) Mean platelet volume (MPV). (J) Red blood cell distribution width/coefficient of variation (RDW/CV).

