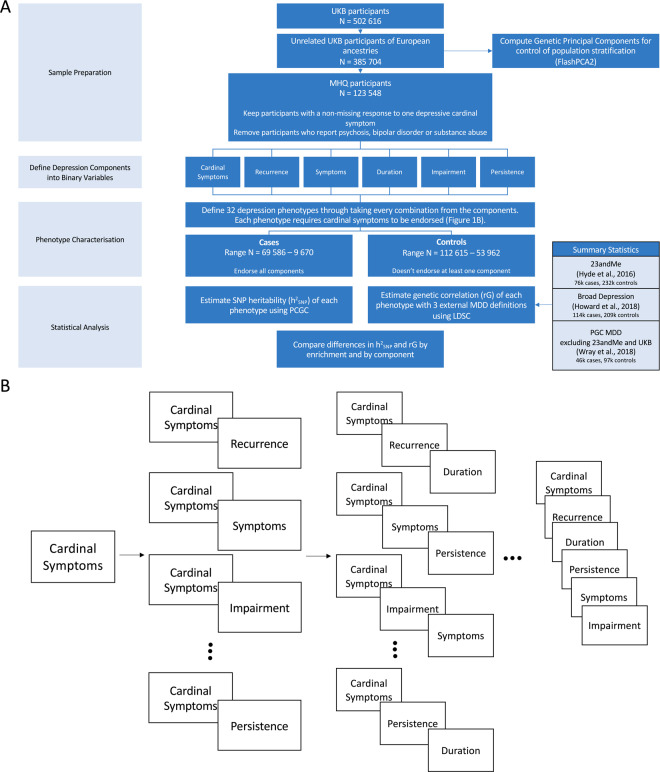
Fig. 1. Workflow of the study design.
A Flow chart of key methodological steps. UKB UK Biobank, PCGC phenotype correlation genotype correlation, LDSC linkage disequilibrium score regression, PGC psychiatric genomics consortium, MDD major depressive disorder. B Characterisation of the 32 phenotypes. B Provides a graphical image of each phenotypes composition. Each time a component is added an additional phenotype is defined. Taking all possible combinations from each addition creates a possible 32 distinct phenotypes. The ellipses have been included in the graph to represent the additional phenotypes not included within the figure.

