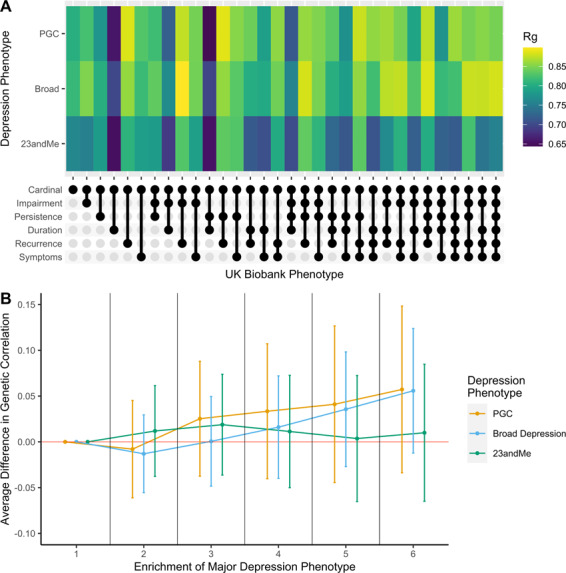
Fig. 3. Analyses in genetic correlations with three previously defined major depression phenotypes.

A A heatmap of genetic correlation estimates for each phenotype. Our defined phenotypes are displayed on the x-axis. The three previously defined major depression phenotypes are displayed on the y-axis. Note: the legend shows the scale for correlation estimate comparisons is between 0.65 and 0.85. B Trend in genetic correlation estimates with PGC defined major depression by phenotype enrichment. Point estimates show the average difference in genetic correlation relative to the cardinal symptom only phenotype. This is shown as the reference point under the first level of phenotype enrichment. Error bars represent the standard errors of the difference.
