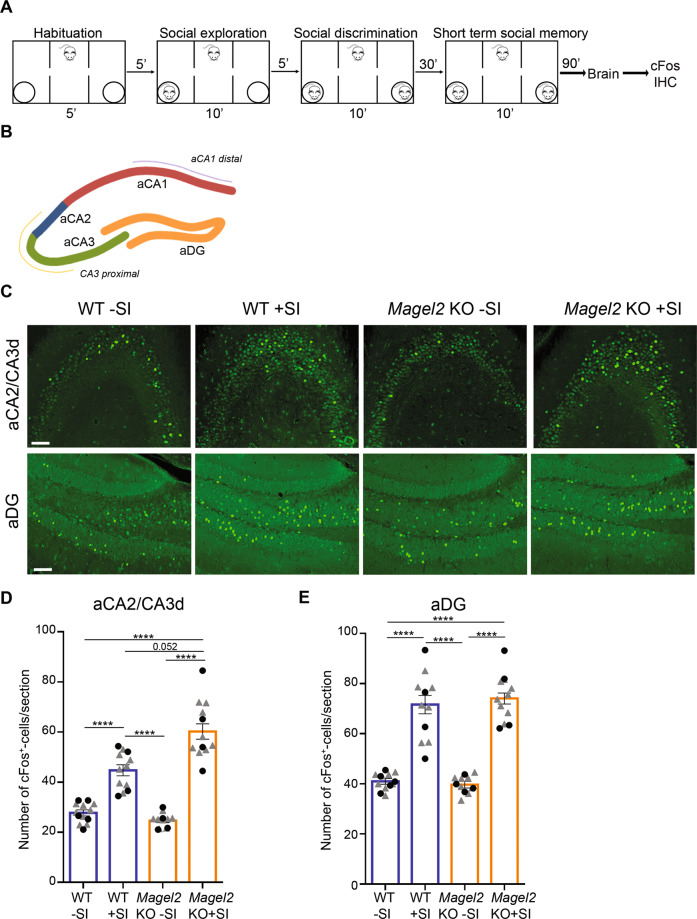
Fig. 3. cFos activity in aCA2/CA3d and aDG regions of Magel2 KO and WT adult male mice following the social memory task in the three-chamber test.
A Paradigm of the three-chamber test (+SI) followed 90 min later by dissection of the brains and immunohistochemistry experiments. Control mice (−SI) were not tested in the three-chamber test. B, C cFos immunolabeling on coronal brain sections in the aCA2/CA3d and aDG regions as indicated in (B) of WT-SI, Magel2 KO-SI, WT + SI and Magel2 KO + SI mice (C). D, E Quantification of cFos+ cells/section in WT-SI (n = 40, N = 5), WT + SI (n = 31, N = 4), Magel2 KO − SI (n = 32, N = 4) and Magel2 KO + SI (n = 30, N = 4) in the aCA2/CA3d region (D) and in the aDG region (E). N number of animals, n number of sections. Scale bar: 500 µm (B); 100 µm (C). Data represented in histograms report the number of cFos+ cells by sections (6–8 sections/animal) as mean ± SEM for the genotype and treatment, with single gray data point (triangle) showing the average for each section level among all individuals of each group (since sections are repeated measures) and single black data point (circle) showing the mean value (of all sections) for each animal. Mixed model with repeated measurements + Tukey’s post hoc test, ***P < 0.001. Statistical analysis is reported in Supplementary Table 2.

