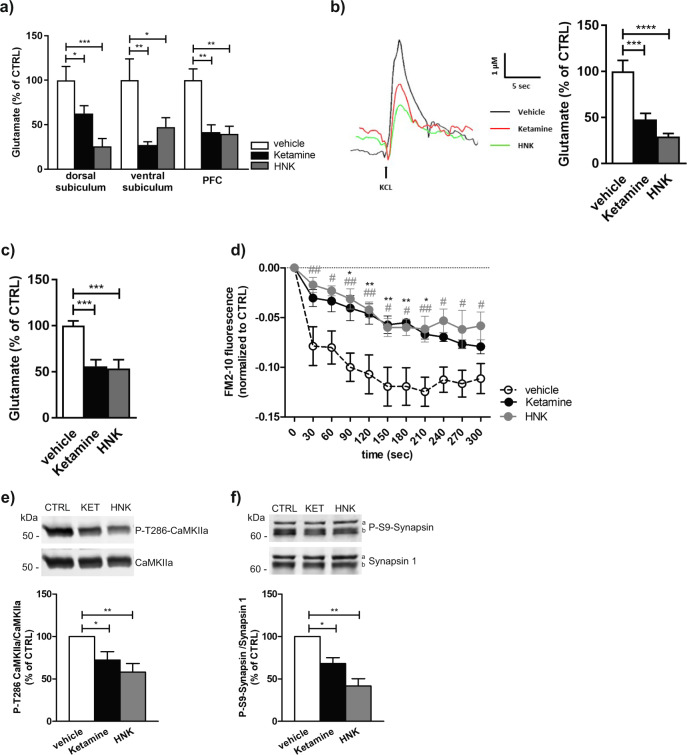
Fig. 1. Acute local and systemic administration of ketamine and (2 R, 6 R)-HNK reduces the presynaptic glutamate release.
a Reduction of KCl-evoked glutamate release upon local application of ketamine or (2 R, 6 R)-HNK (100 µM) into dorsal subiculum, ventral subiculum or prefrontal cortex (PFC) of isoflurane anesthetized mice. Statistical significance was assessed using one-way ANOVA followed by Fisher’s LSD. Dorsal subiculum N = 7 animals per each group; F (2, 18) = 10.44, p = 0.001; ventral subiculum N = 6 vehicle; N = 5 ketamine; N = 6 (2 R, 6 R)-HNK treated mice; F = (2, 13) = 5.15, p = 0.022; PFC N = 6 vehicle; N = 6 ketamine; N = 5 (2 R, 6 R)-HNK treated animals; F (2, 14) = 11.41, p = 0.001. *p < 0.05, **p < 0.01, ***p < 0.001. b Representative examples of traces and corresponding quantification of KCl-evoked glutamate responses upon local application of vehicle, ketamine or (2 R, 6 R)-HNK (100 µM) into dorsal subiculum of freely moving mice. One-way ANOVA followed by Fisher’s LSD, N = 7 animals per each group; F (2, 18) = 20.86, p < 0.0001. ***p < 0.001 ****p < 0.0001. c Reduction of glutamate release 30 min upon systemic administration of ketamine or (2 R, 6 R)-HNK via i.p. injection (15 mg/kg). N = 9 vehicle; N = 9 Ketamine; N = 7 HNK treated mice; F (2, 22) = 13.94, p = 0.0001; ***p < 0.001. d Release of a fluorescent FM2-10 dye upon KCl stimulation of synaptosomes obtained 30 min after i.p. injection of vehicle, ketamine or (2 R, 6 R)-HNK. N = 5 animals per each group; Two-way repeated measures ANOVA followed by Bonferroni’s Multiple Comparison Test; interaction F (20, 120) = 2.35 p = 0.0024; ketamine/HNK F = 9.42, p = 0.0035; time F = 37.55, p < 0.0001; *p < 0.05, **p < 0.01 (ketamine vs vehicle); #p < 0.05, ##p < 0.01 (HNK vs vehicle). e, f Representative western blots and corresponding quantification of pCaMKIIa/CaMKIIa (e) and P-S9-Synapsin/Synapsin 1 (f). Signal for phospho-protein was normalized to total protein and expressed as % of CTRL for each independent experiment. In (f) a denotes Synapsin 1a and b Synapsin 1b. Statistical significance was assessed using one-way ANOVA followed by Bonferroni’s Multiple Comparison Test. In (e) data are obtained from N = 4 independent synaptosomal preparations. F (2, 11) = 13.57, p = 0.006; *p < 0.05, **p < 0.01. In (f) data originated from N = 3 independent synaptosomal preparations. F (2, 8) = 40.86, p = 0.002; *p < 0.05, **p < 0.01. Within each experimental setup, data were normalized to the mean of the control group and expressed as mean ± SEM.

