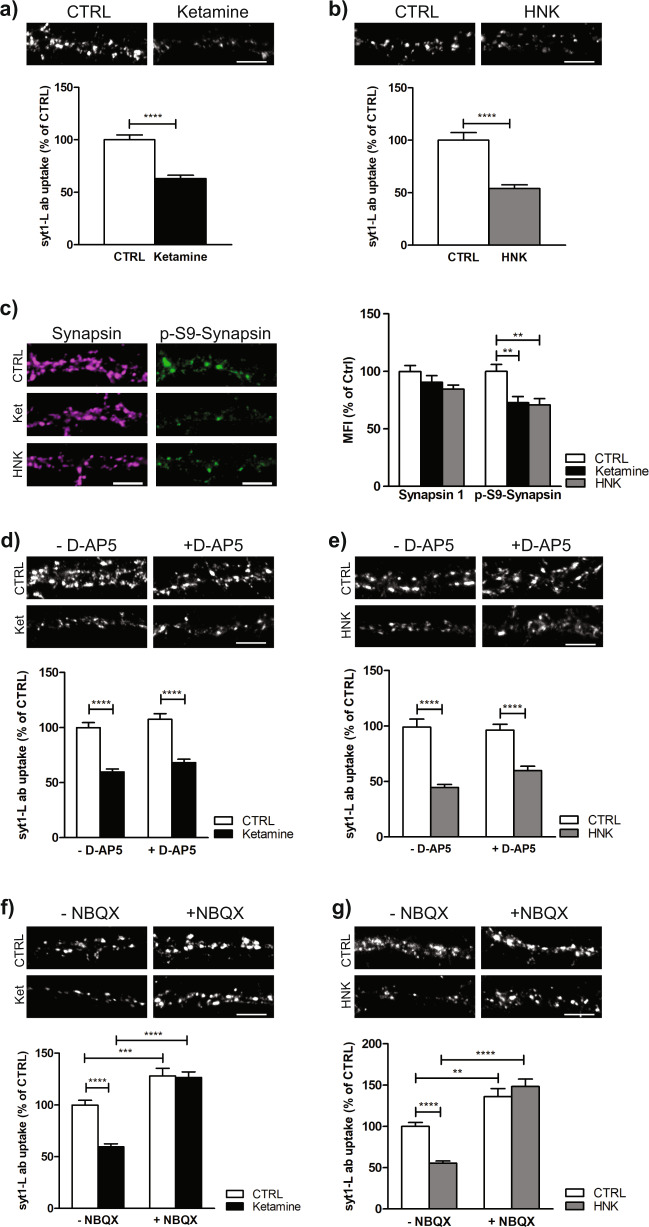
Fig. 2. Acute ketamine and (2R,6R)-HNK induced reduction of presynaptic potentiation is AMPAR dependent, but NMDAR independent.
a Representative images and quantification of KCL-evoked syt1-L ab uptake in CTRL neurons (N = 39) and neurons treated for 30 min with 100 µM ketamine (N = 46); Student’s t test, ****p < 0.0001. b Representative images and quantification of KCL-evoked syt1-L ab uptake in CTRL neurons (N = 27) and neurons treated for 30 min with 100 µM (2 R, 6 R)-HNK (N = 32). Student’s t test, ****p < 0.0001. c Primary cortical neurons treated for 30 min with CTRL solution (N = 30 cells), 100 µM ketamine (N = 28 cells) or 100 µM (2 R, 6 R)-HNK (N = 32 cells), fixed and stained for total Synapsin 1 (magenta) or P-S9-Synapsin (green). The graph represents a quantification of the signal in corresponding channels. One-way ANOVA followed by Bonferroni’s Multiple Comparison Test. Synapsin 1 F (2, 89) = 2.62; p = 0.078; P-S9-Synapsin F (2, 89) = 8.47; p = 0.0004; **p < 0.01. d Representative images and quantification of KCL-evoked syt1-L ab uptake in cells treated for 30 min with 100 µM ketamine in the absence or presence of NMDAR antagonist D-AP5 (30 min; 50 µM) (CTRL N = 35; ketamine N = 40; D-AP5 N = 30; D-AP5/ketamine N = 37 cells). Two-way ANOVA with Bonferroni’s Multiple Comparison Test, interaction F (1, 138) = 0.02 p = 0.89; ketamine F = 105.44 p < 0.0001; D-AD5 F = 4.35 p = 0.039; ****p < 0.0001. e Representative images and quantification of KCL-evoked syt1-L ab uptake in cells treated for 30 min with 100 µM (2 R, 6 R)-HNK (CTRL N = 26: HNK N = 32; D-AP5 N = 27; D-AP5/HNK N = 32 cells) in the absence or presence of NMDAR antagonist D-AP5 (30 min; 50 µM). Two-way ANOVA with Bonferroni’s Multiple Comparison Test, F (1, 114) = 3.42 interaction p = 0.067; (2 R, 6 R)-HNK F = 88.28 p < 0.0001; D-AD5 F = 1.72 p = 0.19; ****p < 0.0001. f Representative images and quantification of KCL-evoked syt1-L ab uptake in cells treated with ketamine (30 min; 100 µM) without or with co-treatment with NBQX (30 min; 10 µM) (CTRL N = 35; ketamine N = 40; NBQX N = 34; NBQX/ketamine N = 27 cells). Two-way ANOVA with Bonferroni’s Multiple Comparison Test, interaction F (1, 132) = 14.25 p = 0.0002; ketamine F = 16.32 p < 0.0001; NBQX F = 84.64 p < 0.0001; ***p < 0.001, ****p < 0.0001. g Representative images and quantification of KCL-evoked syt1-L ab uptake in cells treated with (2 R, 6 R)-HNK in the absence or presence of NBQX (30 min; 10 µM) (CTRL N = 25; HNK N = 31; NBQX N = 34; NBQX/Ketamine N = 26 cells). Two-way ANOVA with Bonferroni’s Multiple Comparison Test, interaction F (1, 112) = 14.29 p = 0.0003; (2 R, 6 R)-HNK F = 4.57 p < 0.035; NBQX F = 73.88 p < 0.0001; **p < 0.01, ****p < 0.0001. All data originate from 3 independent cell culture experiments. Bars denote intensity values normalized to the mean intensity value in the control group ± SEM per each experiment. Scale bar 5 µm.

