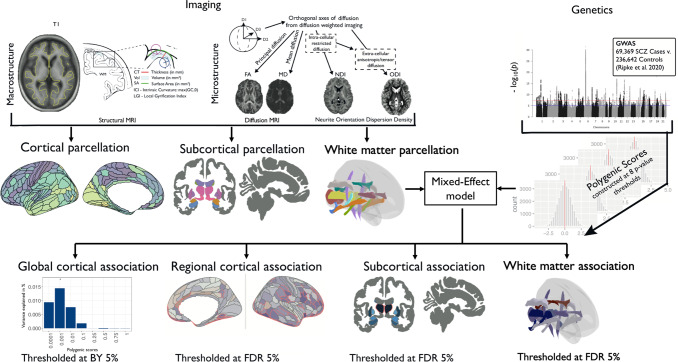
Fig. 1. Schematic summary of the study.
We estimated five macrostructural metrics and four microstructural metrics at each of 180 bilateral cortical areas, and on average over all cortical areas, for variable numbers of subjects in the UK Biobank for whom quality-controlled data were available: for cortical thickness (CT), N = 29,778; surface area (SA), N = 29,777; grey matter volume (Vol), N = 29,778; intrinsic curvature (IC), N = 29,676; local gyrification index (LGI), N = 27,086; fractional anisotropy (FA), N = 28,232; mean diffusivity (MD), N = 28,165; neurite density index (NDI), N = 27,632; and orientation dispersion index (ODI), N = 27,658. We also estimated one macrostructural metric and four microstructural metrics at each of seven subcortical regions (amygdala, accumbens, caudate, putamen, pallidum, hippocampus, and thalamus): Vol, N = 29,854–29,878; FA, N = 28,192–28,238; MD, N = 27,664–28,154; NDI, N = 27,590–27,638; and ODI, N = 27,600–27,658. Additionally, we measured four microstructural metrics at 15 major white matter tracts: FA, N = 27,987–28,346; MD, N = 28,327–28,346; NDI, N = 28,247–28,337; ODI, N = 28,219–28,346. Polygenic risk scores for schizophrenia (PRS) were based on GWAS data from 69,396 cases and 236,642 controls and were calculated for each participant at eight PSNP-value thresholds for inclusion of significant variants, using the clumping and thresholding approach [46]. To assess associations between multiple schizophrenia polygenic risk scores and cortical phenotypes, we first used mixed-effect models to identify which PSNP-value threshold(s) produced the PRS most strongly associated with each cortical metric at global scale, controlled for multiple comparisons using the Benjamini–Yekutieli procedure (BY = 5%). We then used mixed-effect models to test the association between the globally most predictive PRS for each metric at each cortical area, controlling for multiple comparisons with the false-discovery rate (FDR) at 5%. For subcortical structures and white matter tracts, we tested for association between each MRI metric and each of eight polygenic risk scores, with FDR = 5%. The Manhattan plot is for illustrative purposes only and based on a previously published schizophrenia GWAS [49], downloaded from https://www.med.unc.edu/pgc/pgc-workgroups/.

