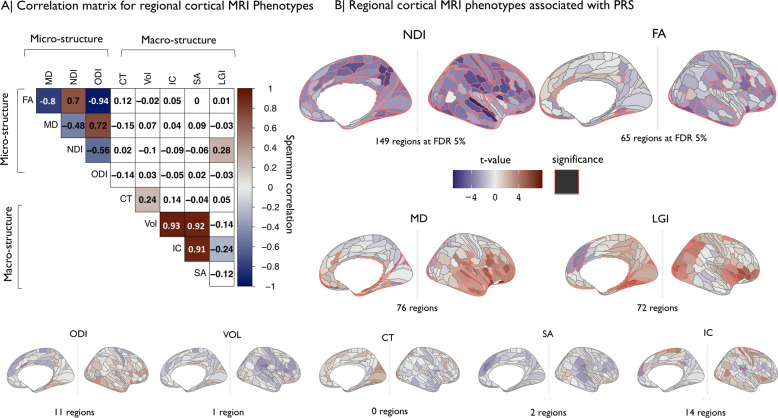
Fig. 3. Regional cortical MRI phenotypes: correlations between metrics and associations of each metric with schizophrenia polygenic risk scores.
A Matrix of Spearman’s correlation for each pair of nine MRI metrics. Shades of blue indicate significant negative correlations and shades of red indicate significant positive correlations. B Cortical t-maps representing the strength of association between schizophrenia PRS and regional MRI phenotypes; regions where the effect of PRS is statistically significant at FDR = 5% are outlined in red. NDI and FA metrics, which were globally decreased by genetic risk for schizophrenia (Fig. 2), were significantly regionally decreased in multiple areas. MD and LGI metrics were significantly regionally increased by genetic risk in several areas.

