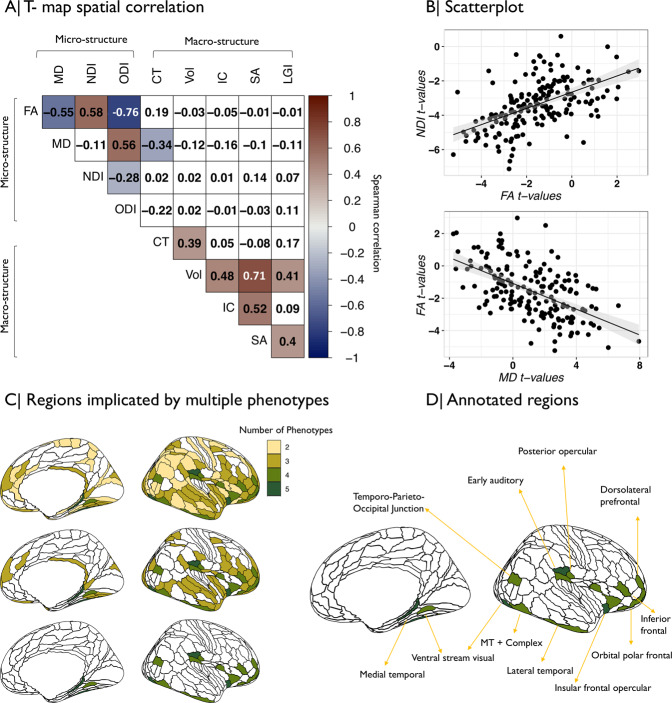
Fig. 4. Anatomical co-localization of polygenic risk effects for schizophrenia on multiple MRI phenotypes.
A Matrix of spatial correlations between cortical t-maps of association between schizophrenia PRS and nine MRI metrics. B Scatterplot showing the relationships between (top) cortical t-maps of FA and NDI and (bottom) cortical t-maps of FA and MD; each point represents a cortical area. C Cortical map color coded to indicate the number of MRI phenotypes that were significantly associated with schizophrenia PRS at each region. Colored regions had at least two (top), three (middle), or four (bottom), MRI phenotypes significantly associated with genetic risk of schizophrenia. D The brain regions where schizophrenia PRS was significantly associated with four MRI phenotypes were anatomically located in medial and lateral temporal cortex, ventral visual stream, insular and frontal cortex.

