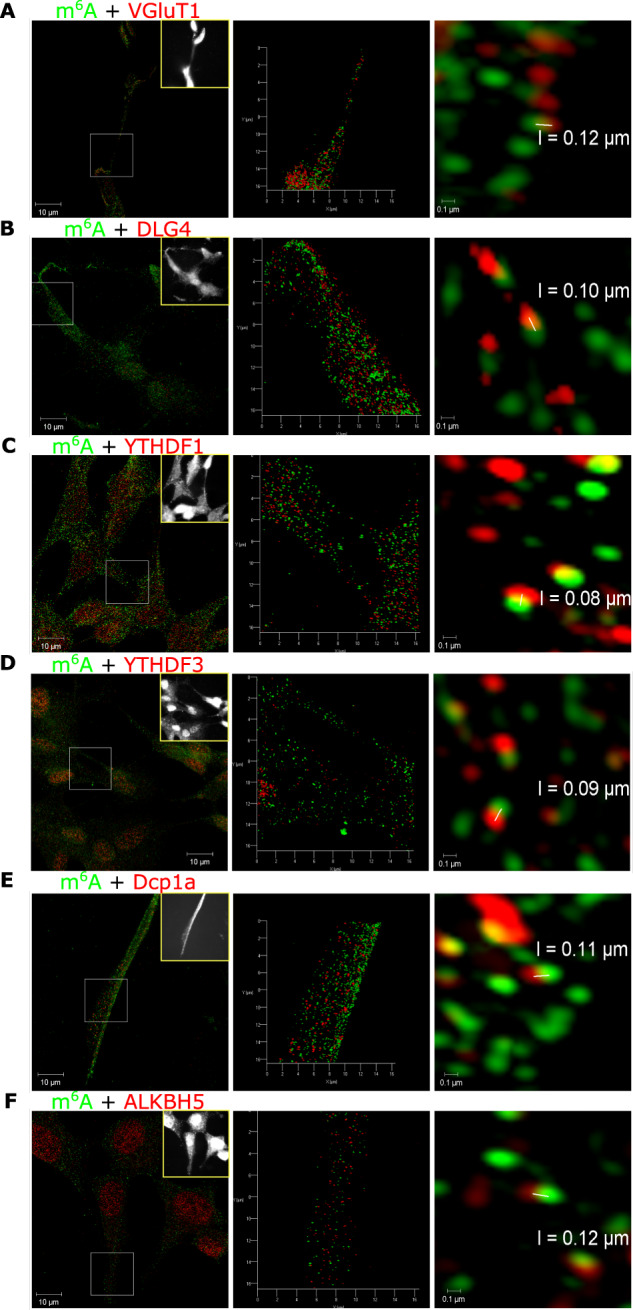
Fig. 1. Spatial mapping of m6A-modified transcripts and m6A-binding proteins at synapses.

Super resolution structured illumination 3D microscopy of differentiated human neuronal cells shows colocalisation of m6A modified transcripts (green) with A presynaptic VGluT1 (red), B post synaptic PSD-95/DLG4 (red), C YTHDF1 reader (red), D YTHDF3 reader (red), E Dcp1a (red), F ALKBH5 eraser (red). Left column, maximum intensity projections SIM images of the widefield grey scale inset image (yellow box). Middle column, 3D models of zoomed in regions of interest (white squares in the left column). Right column, resolution at which two fluorescent puncta can be discerned (range 80–120 nm).
