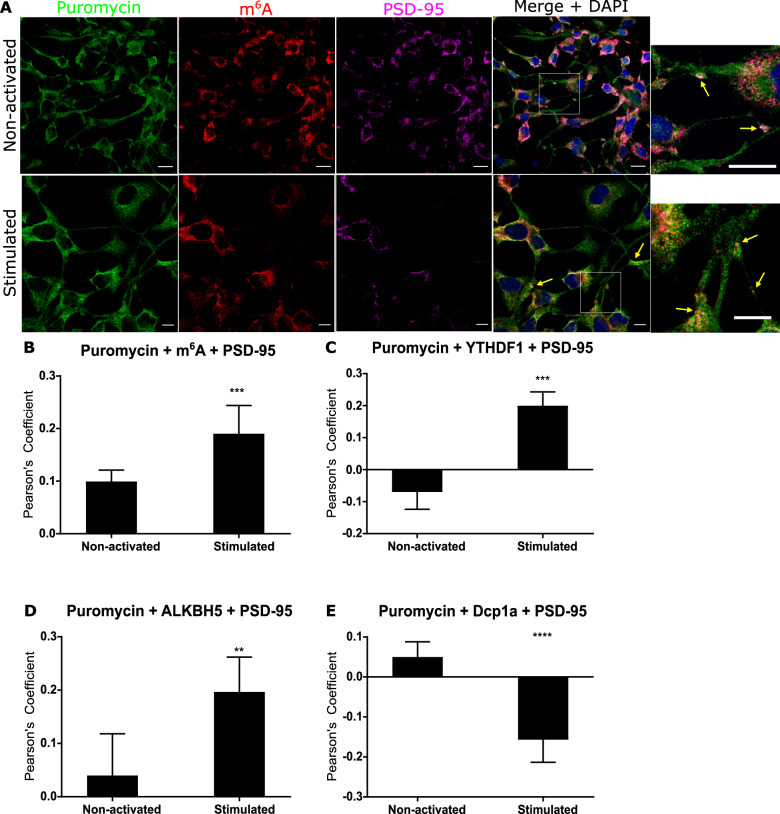
Fig. 3. m6A-modified RNAs increase at actively translating synaptic ribosomes 15 min after synaptic activation.
A Confocal microscopy indicates non-activated and NMDA activated dTE671 cells show regions of colocalisation between m6A-modified RNA (red) at post synaptic sites (PSD-95, magenta) and translationally active ribosomes indicated by puromycin binding (green). Mean Pearson’s Correlation Coefficient calculated for colocalisation between actively translating ribosomes 15 min after activation and (B) m6A modified transcripts (C) YTHDF1 reader, (D), ALKBH5 eraser (E) and Dcp1a in postsynaptic areas. Error bars denote 95% CI. *p ≤ 0.05, **p ≤ 0.005, ***p ≤ 0.0005.

