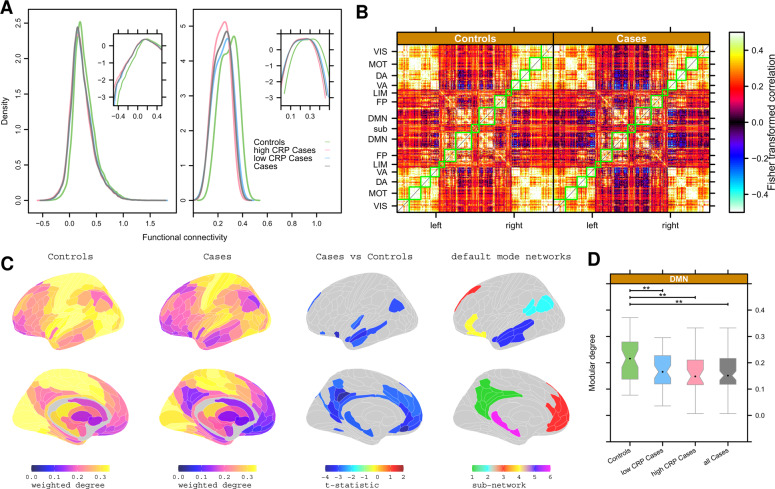
Fig. 2. Functional connectivity: depression-related differences.
A Left, group mean distributions of pair-wise correlation or functional connectivity for all controls, all cases, and high or low CRP subgroups of cases. Right, group mean distribution of weighted degree or nodal hubness for all controls, all cases, and high or low CRP subgroups of cases. Insets show the same data on a log scale to clarify between-group differences in the negative (or less positive) tails of the distributions. B Group mean functional connectivity matrices for all controls (left) and all cases (right). Each row or column in these symmetrical matrices represents one of 360 cortical regions which have been ordered by their prior affiliation to resting state networks or modules [57]: VIS = visual, MOT = motor, DA = dorsal attentional, VA = ventral attentional, LIM = limbic, FP = fronto-parietal, DMN = default mode network. In total, 16 subcortical regions are designated SUB. C Cortical and subcortical maps of group mean weighted degree for controls and cases, and the map of significant case-control differences in weighted degree (PFDR < 0.05). In both groups, high degree hub nodes were concentrated in somatosensorimotor, visual and auditory cortices; low degree non-hub nodes were concentrated in DMN cortical areas and subcortical structures. There was significantly reduced hubness of nodes in many cortical areas of the default mode network (DMN, right column). D Boxplots of weighted degree of all cortical nodes in the DMN for all controls, all cases, and high or low CRP subgroups of cases. ** denotes significant between-group differences in modular degree of DMN (P < 0.05).

