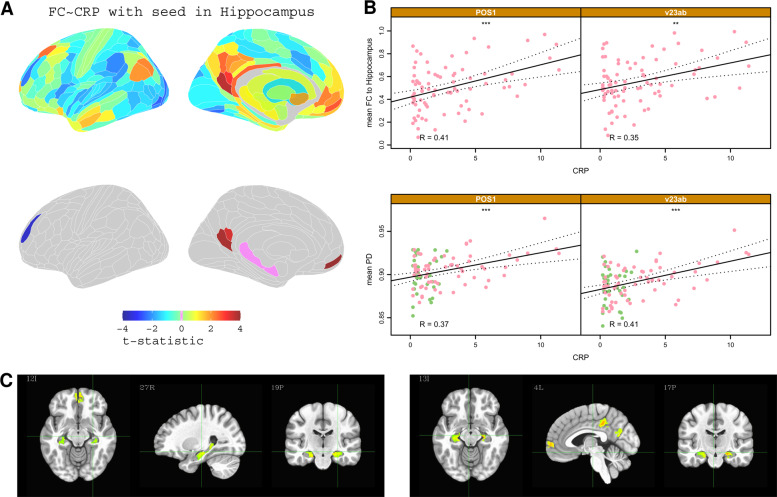
Fig. 4. Hippocampal connectivity: correlation with CRP.
A Top row, brain maps of t-statistics representing strength of association between CRP and functional connectivity of the hippocampus (with each of the other brain regions). Bottom row, cortical maps highlighting regions where CRP was significantly, positively correlated with functional connectivity with the hippocampus (PFDR < 0.05). B Scatterplots illustrating the relationship between CRP and hippocampus connectivity for two cortical regions: POS1 and v23ab. Bottom, scatterplots of CRP versus PD for the same cortical regions; * denotes P < 0.05. C Voxel based analysis of functional connectivity dependence on CRP for a seed in the PCC (top row) and for a seed in the right Hippocampus (bottom row). Functional connectivity between hippocampus, PCC, and mPFC was positively correlated with CRP (only significant clusters with α < 0.05 are shown; global significance threshold P < 0.05).

