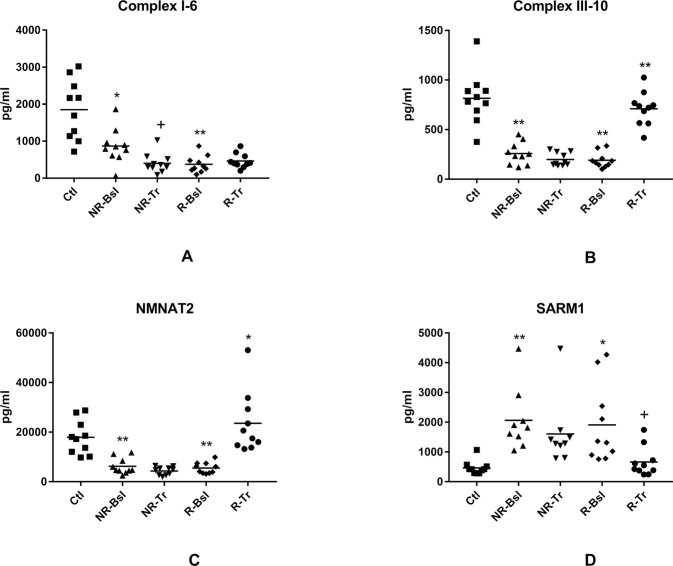
Fig. 2. NDEV levels of proteins involved in mitochondrial generation of energy.
Statistical methods and symbols are the same as in Fig. 1. The mean ± S.E.M. of Ctl, NR-Bsl, NR-Tr, R-Bsl and R-Tr groups, respectively, were 1852 ± 255 pg/ml, 867 ± 149 pg/ml (0.0037), 401 ± 83 pg/ml (0.0147), 374 ± 74 pg/ml (<0.0001) and 465 ± 63 pg/ml (NS) for Complex I-subunit 6 (A); 815 ± 83 pg/ml, 258 ± 35 pg/ml (≤0.0001), 199 ± 21 pg/ml (NS), 191 ± 25 pg/ml (<0.0001) and 710 ± 54 pg/ml (<0.0001) for Complex III-subunit 10 (B); 17,908 ± 2171 pg/ml, 6200 ± 1011 pg/ml (<0.0001), 4345 ± 507 pg/ml (NS), 5534 ± 711 pg/ml (<0.0001) and 23,564 ± 3932 pg/ml (0.0014) for NMNAT2 (C); and 466 ± 74 pg/ml, 2063 ± 351 pg/ml (0.0002), 2695 ± 1047 pg/ml (NS), 1908 ± 416 pg/ml (0.0031) and 664 ± 156 pg/ml (0.0368) for SARM1 (D). Mean ± S.E.M. of levels of the same mitochondrial proteins in NDEV of our previously reported sets (n = 10) of controls and participants with a first episode of psychosis [16], respectively, were 1574 ± 246 pg/ml and 542 ± 42.1 pg/ml (0.0007) for Complex I-subunit 6; 1404 ± 112 pg/ml and 635 ± 53.8 pg/ml (<0.0001) for Complex III-subunit 10; 7293 ± 825 pg/ml and 4804 ± 827 pg/ml (0.0471) for NMNAT2; and 974 ± 130 pg/ml and 1160 ± 75.4 pg/ml (NS) for SARM1.

