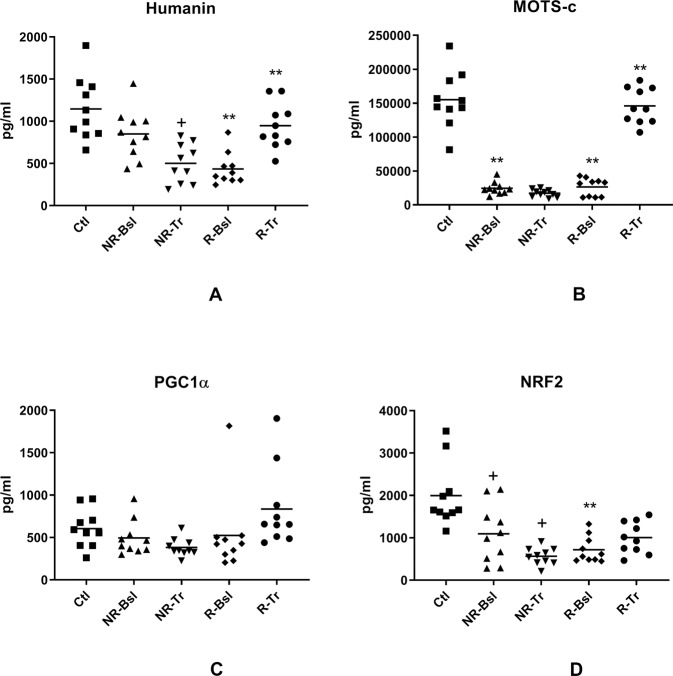
Fig. 3. NDEV levels of proteins involved in mitochondrial biogenesis and in mitochondrial regulation of neuronal metabolism and survival.
Statistical methods and symbols are the same as in Fig. 1. The mean ± S.E.M. of Ctl, NR-Bsl, NR-Tr, R-Bsl and R-Tr groups, respectively, were 1146 ± 118 pg/ml, 850 ± 93.8 pg/ml (NS), 500 ± 73.4 pg/ml (0.0308), 434 ± 59.9 pg/ml (<0.0001) and 947 ± 86.1 pg/ml (<0.0001) for humanin (A); 155,054 ± 13,122 pg/ml, 24,396 ± 2917 pg/ml (<0.0001), 17,126 ± 1757 pg/ml (NS), 26,252 ± 4184 pg/ml (<0.0001) and 145,947 ± 8370 pg/ml (<0.0001) for MOTS-c (B); 605 ± 71.2 pg/ml, 494 ± 65.1 pg/ml (NS), 382 ± 33.4 pg/ml (NS), 524 ± 148 pg/ml (NS) and 835 ± 149 pg/ml (NS) for PGC1α (C); and 1994 ± 240 pg/ml, 1096 ± 216 pg/ml (0.0122), 563 ± 64.2 pg/ml (0.0439), 719 ± 97.7 pg/ml (0.0001) and 1006 ± 119 pg/ml (NS) for NRF2 (D). Mean ± S.E.M. of levels of the same mitochondrial proteins in NDEV of our previously reported sets (n = 10) of controls and participants with a first episode of psychosis [16], respectively, were 1752 ± 288 pg/ml and 207 ± 26.1 pg/ml (<0.0001) for humanin; 169,267 ± 12,247 pg/ml and 20,782 ± 2506 pg/ml (0.0007) for MOTS-c; 860 ± 92.5 pg/ml and 675 ± 70.6 pg/ml (NS) for PGC1α; and 1486 ± 223 pg/ml and 556 ±54.6 pg/ml (0.0008) for NRF2.

