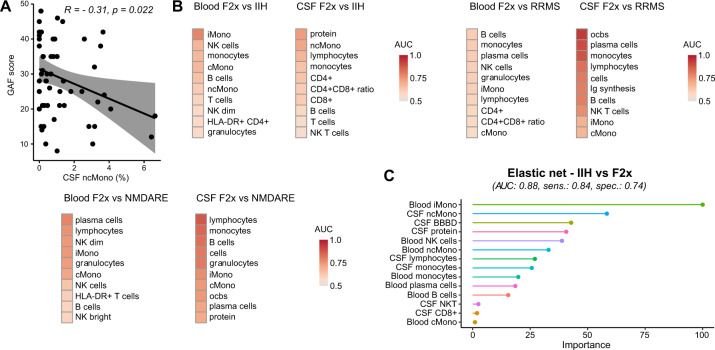
Fig. 4. Non-classical monocytes in CSF correlate with psychosis severity and multiparametric models distinguish F2x from control patients.
A Disease severity was assessed by the GAF. Correlation analysis was performed with the Pearson correlation coefficient (R) and linear regression analysis. The gray areas show the confidence interval. B ROC analysis of F2x, IIH, RRMS and NMDARE patients with basic CSF, blood, and CSF flow cytometry parameters: AUC values were calculated, sorted by value, and depicted in a heatmap. C Blood and CSF parameters were combined, and the most powerful parameters were identified by different machine learning approaches. Feature selection methods were applied to reduce the numbers of predictors. We used the distance metric from perfect sensitivity and specificity as the performance metric. Different models were trained to minimize the distance and the final models were benchmarked based on AUC, sensitivity, and specificity (Supplementary Fig. 4). The top performing machine learning approaches were chosen. The variable importance of the best performing machine learning approaches are shown. When comparing IIH to F2x, F2x was defined as positive and IIH as negative. (AUC: area under the curve; BBBD: blood-brain-barrier dysfunction; cMono: classical monocytes; CSF: cerebrospinal fluid; F2x: patients with psychotic disorder; Ig: immunoglobulin; IIH: intracranial hypertension; iMono: intermediate monocytes; LDA RFE: recursive feature elimination based on linear discriminant analysis; NB: naive bayes; NK: natural killer cells; ncMono: non-classical monocytes; NMDARE: anti-NMDA-receptor encephalitis; ocb: oligoclonal band; ROC: receiver operating characteristic; RRMS: Relapsing-Remitting Multiple Sclerosis; Sens: sensitivity; Spec: specificity).

