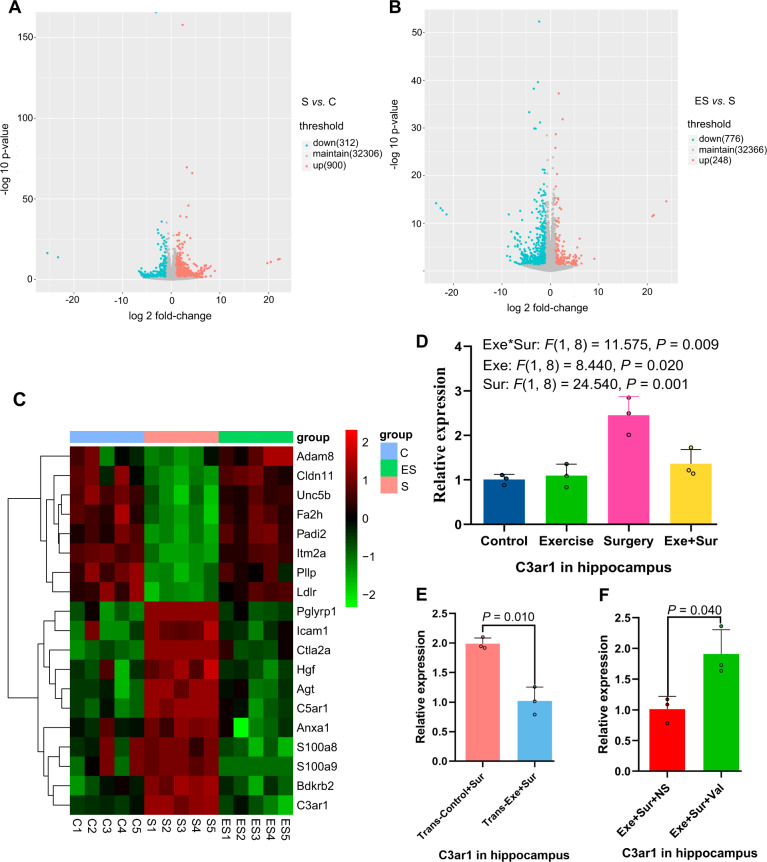
Fig. 3. mRNA expression profile of mice.
Hippocampal samples were subjected to RNA-seq analysis. A, B Volcano plot. C Heatmap of mRNA abundance of genes whose expression was different among the three groups of animals. D–F Quantitative data of real-time PCR analysis. Results in (panels D–F) are mean ± S.D. with presentation of value of individual mouse (n = 5 for panels A–C, and = 3 for panels D–F). C control, S or Sur surgery, ES or Exe+Sur exercise plus surgery, Trans-Control: mice transplanted with feces from control mice, Trans-Exe: mice transplanted with feces from exercise mice, NS normal saline, Val valeric acid.

