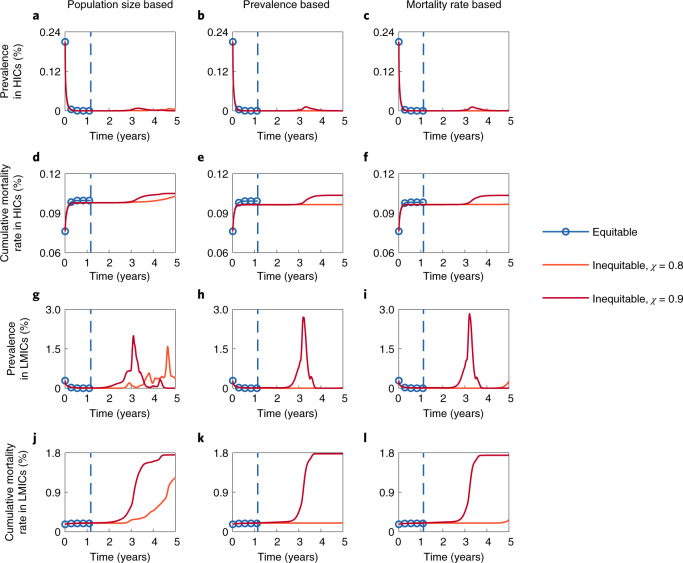
Fig. 2. Impacts of equitable and inequitable vaccine allocation strategies on epidemic dynamics.
a–f, Time series of the prevalence (a–c) and the cumulative mortality rate (d–f) in HICs under different global vaccine allocation strategies. g–l, Time series of the prevalence (g–i) and the cumulative mortality rate (j–l) in LMICs under different global vaccine allocation strategies. Three prioritization criteria for allocation are adopted: the population size (left), prevalence (middle) and mortality rate (right). The dashed lines in each panel indicate the time when the pandemic ends if the corresponding prioritization criterion is adopted (time exceeding five years is not presented). The dashed line and the solid line referring to the same global vaccine allocation strategy are represented by the same colour. The transmissibility and severity of each strain and the vaccine efficacy against each strain are shown in Supplementary Fig. 2. Parameter values: M = 5, μ1 = 5.6 × 10⁻³, θ = 0.2 and λ = 5 × 10² (λ is the decrease rate of the probability of emergence of new and more dangerous strains).

