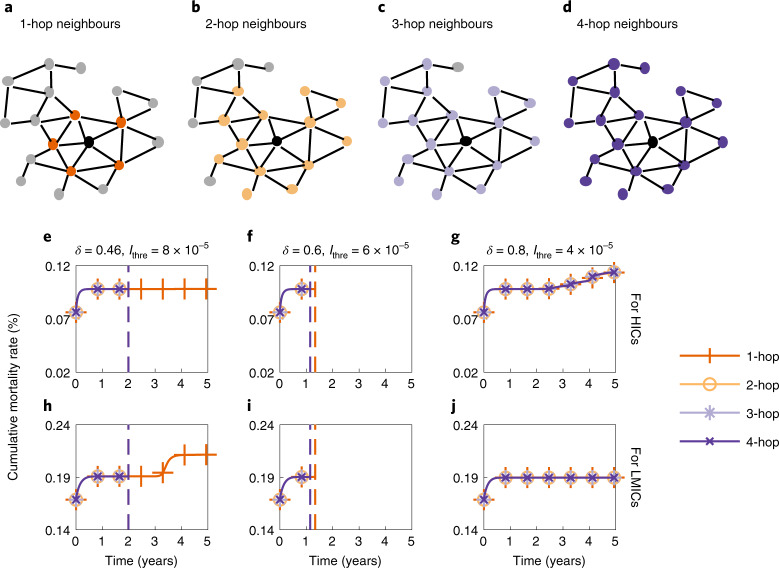
Fig. 5. Impact of donating vaccines to neighbouring LMICs.
a–d, A country (the black node) and its 1-hop (a), 2-hop (b), 3-hop (c) and 4-hop (d) neighbours on the global mobility network (Supplementary Fig. 27) constructed on the basis of the air traffic data. e–j, Cumulative mortality rate in HICs (e–g) and LMICs (h–j) over time if HICs donate vaccines to only their 1-hop, 2-hop, 3-hop and 4-hop LMIC neighbours under scenarios where δ = 0.46 and Ithre = 8 × 10⁻⁵ (e and h), δ = 0.6 and Ithre = 6 × 10⁻⁵ (f and i), and δ = 0.8 and Ithre = 4 × 10⁻⁵ (g and j). The dashed lines indicate the time when the pandemic ends. Countries with larger population sizes are prioritized for vaccination. Parameter values: M = 5, μ1 = 5.6 × 10⁻³, θ = 0.2 and λ = 5 × 10².

