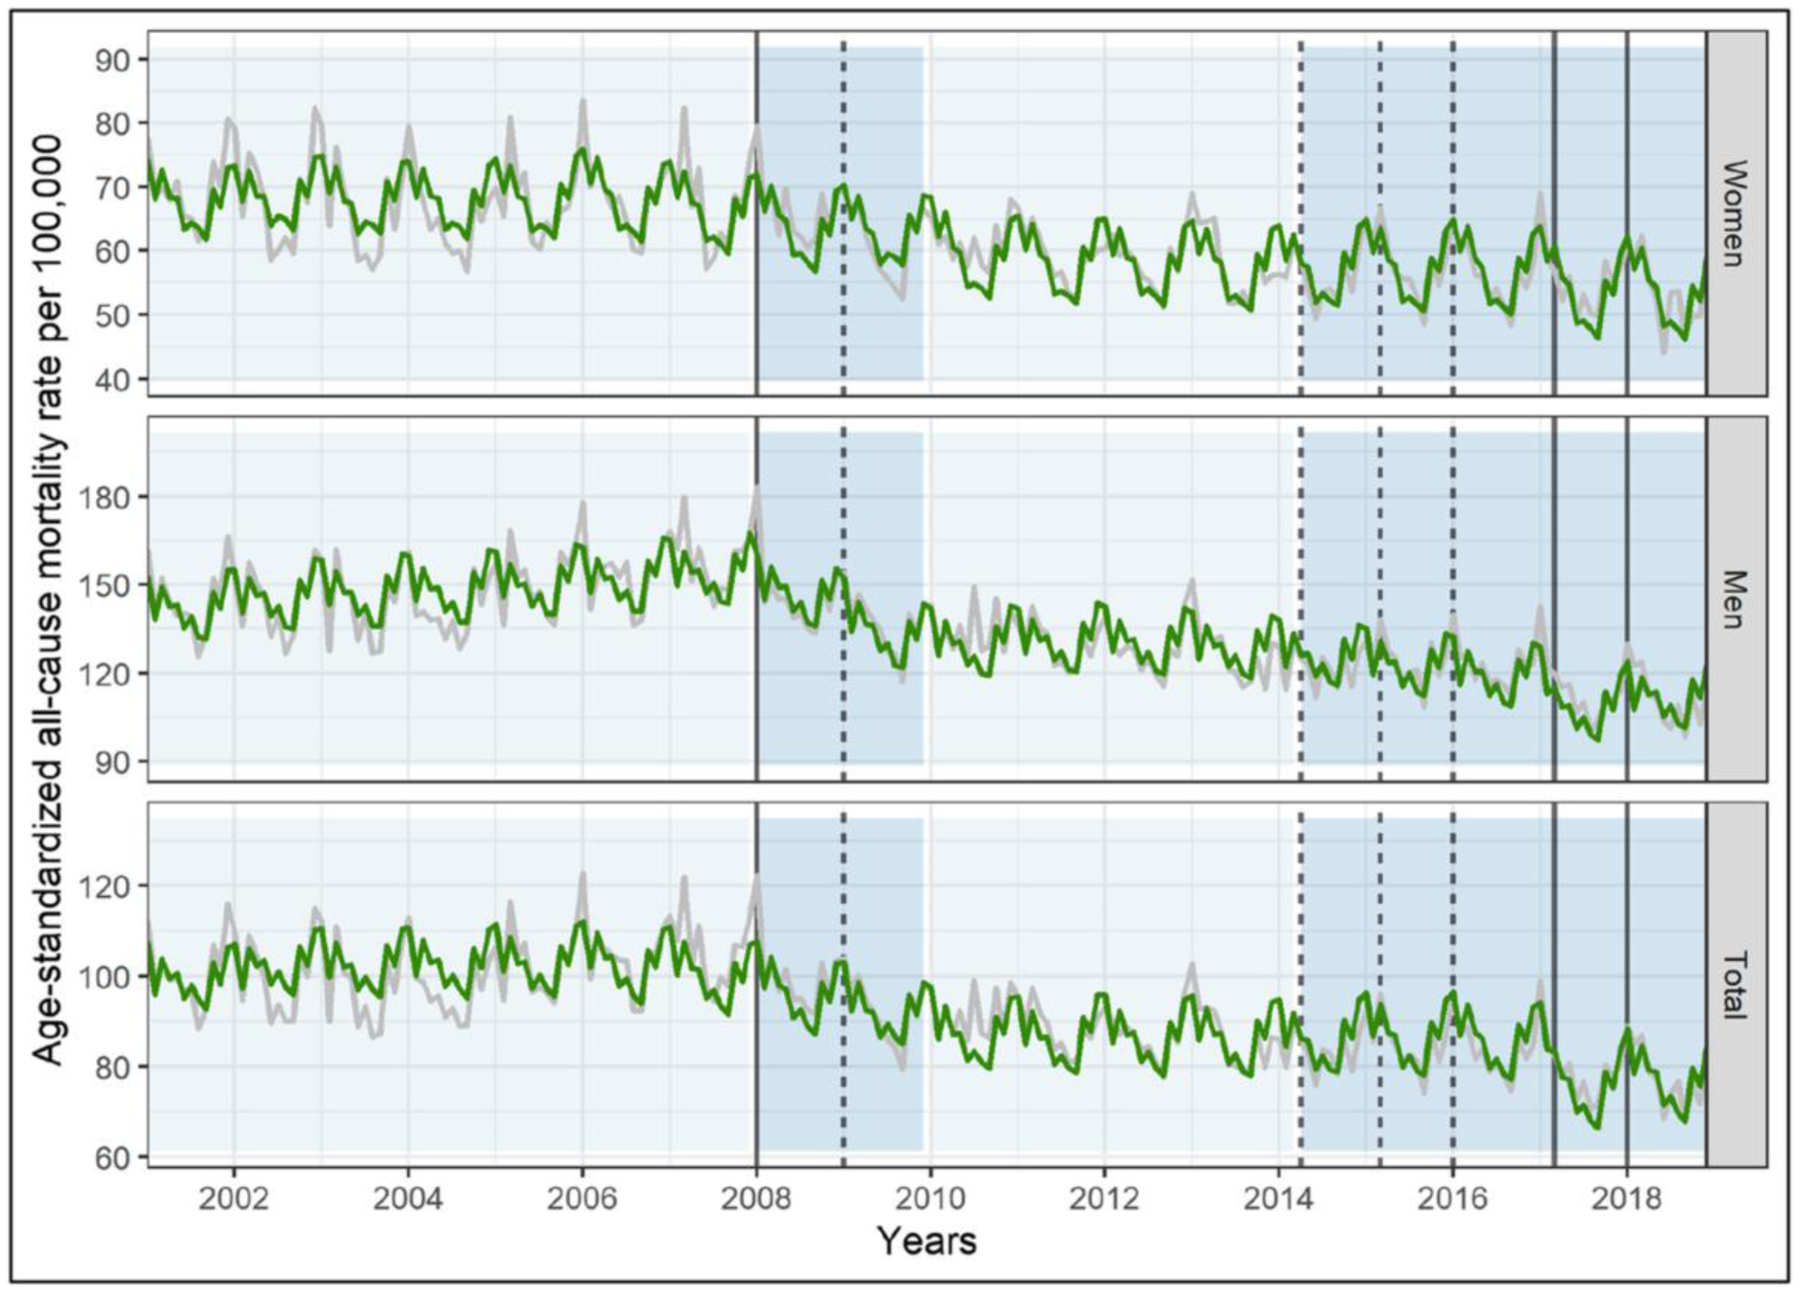
Figure 1.

Age-standardized all-cause mortality rates by sex for the period 2001–18 in Lithuania. Gray lines indicate observed mortality rates, green lines indicate modelled mortality rates (from analysis 3). Vertical lines indicate alcohol policy implementation dates; vertical solid lines indicate three sets of policies with the highest expected impact; vertical dashed lines indicate additional four sets of policies rated to be impactful by experts. Light blue shaded areas indicate periods 1 and 3 during which no effective alcohol policies implemented, dark blue shaded areas indicate periods 2 and 4 during which several effective alcohol policies were implemented in each of the years
