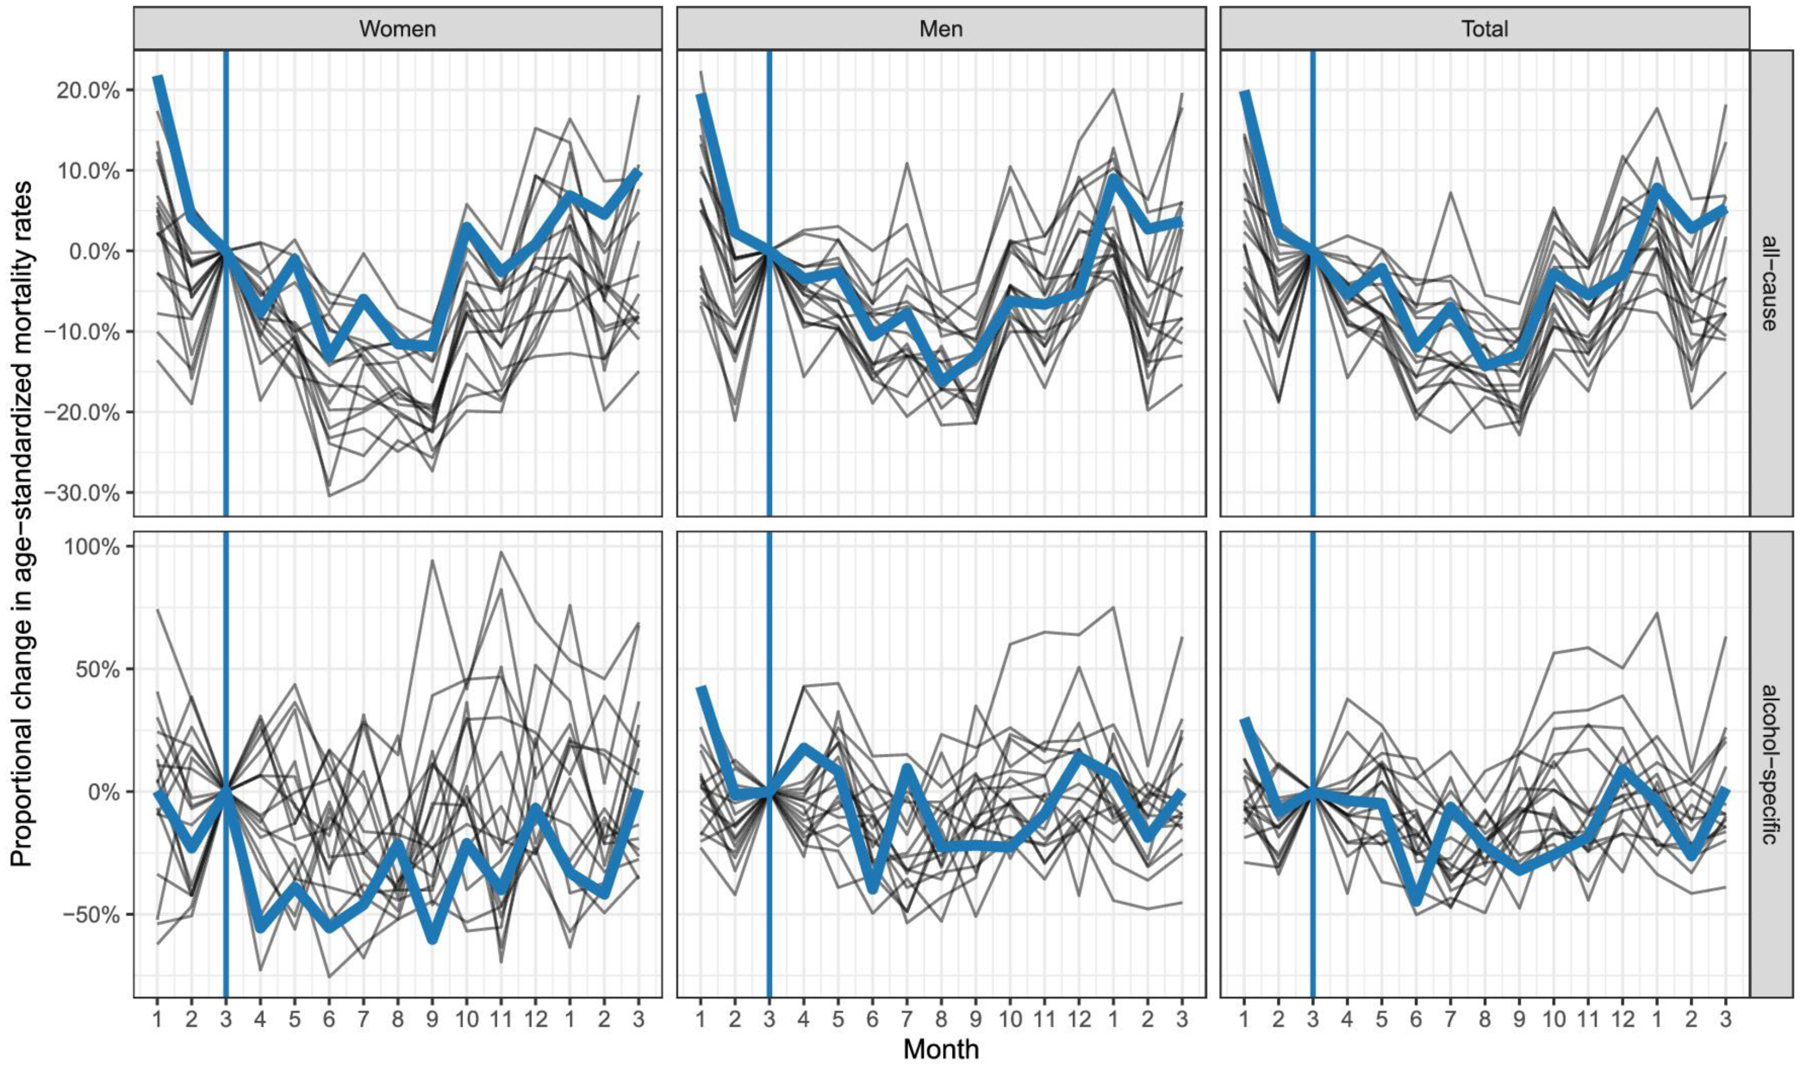
Figure 2.

Sex-specific proportional changes in age-standardized all-cause and alcohol-specific mortality rates relative to March in each year for the period 2001–18 in Lithuania (black thin lines for all years other than 2017, blue thick lines for 2017; vertical blue line indicates March, i.e. month of implementation of 2017 policy)
