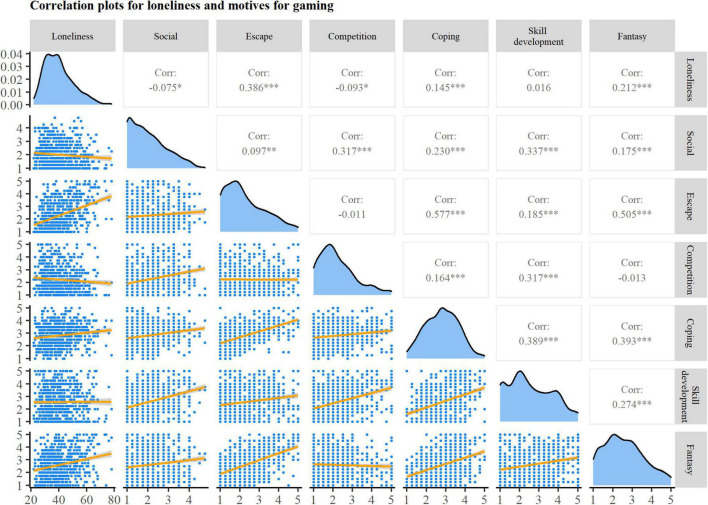
FIGURE 2.
Correlation plot between loneliness and motives for gaming. Upper triangle: Correlation coefficients. Significant correlations are marked with asterisks (*p < 0.05; **p < 0.01; ***p < 0.001). Diagonal: Density plot of individual variables. Lower triangle: Scatterplots for each correlation; gray shaded area indicates 95% confidence region for the correlation.

