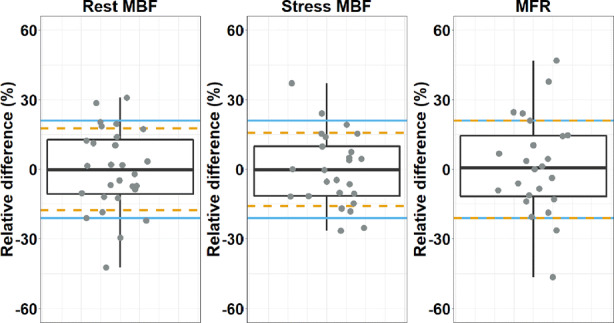
Figure 6.

Boxplots showing individual relative differences (%) of the rest MBF (N = 28), stress MBF (N = 25), and MFR (N = 24) when comparing the D690 with the Vereos PET system. The SD of the relative differences by the orange dashed lines and the test–retest precision of 21% by the blue solid lines. Each dot represents a single patient. As the MFR is the ratio between stress and rest MBF, large MFR differences presumably arise from a large change in stress MBF and minimal change in rest MBF or vice versa
