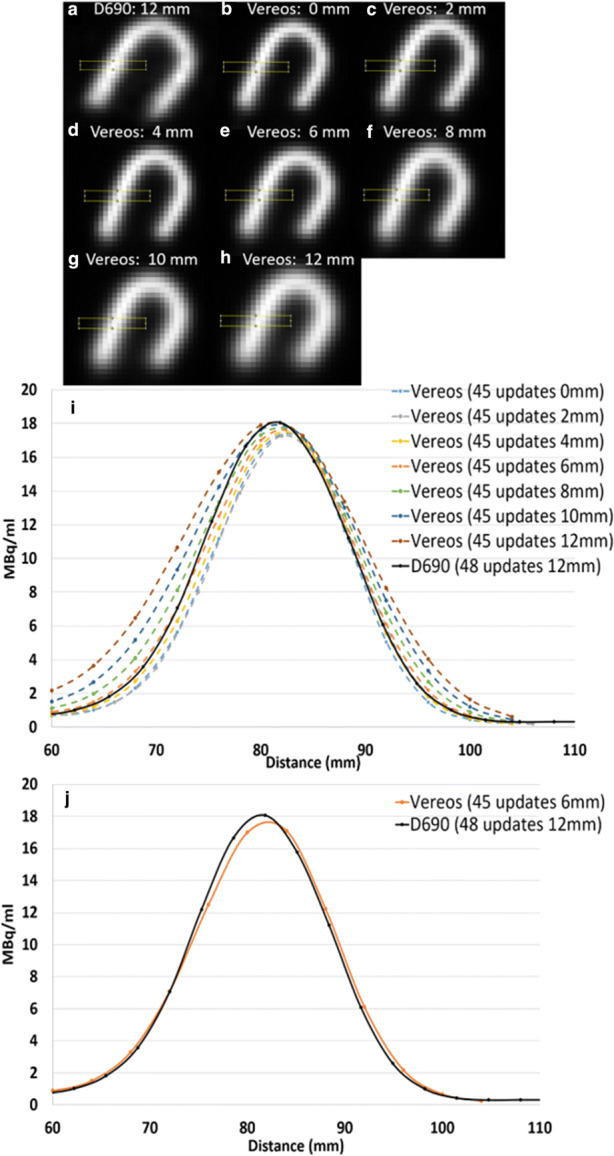
Figure 7.

Reconstructed PET images of an Rb-82-filled Cardiac Insert phantom using the D690 (A) with 2 iterations, 24 subsets and a Gaussian post-smoothing filter of 12 mm and using the Vereos (B-H) with 3 iterations, 15 subsets and Gaussian post-smoothing filter ranging from 0-12 mm. The rectangles were used to plot intensity profiles. The width of the profile increases when increasing the filter for the Vereos reconstructions (I). The intensity profile reconstructed on the Vereos using 3 iterations, 15 subsets and a Gaussian post-smoothing filter of 6 mm is most similar to the profile using the image reconstruction of the D690 (J)
