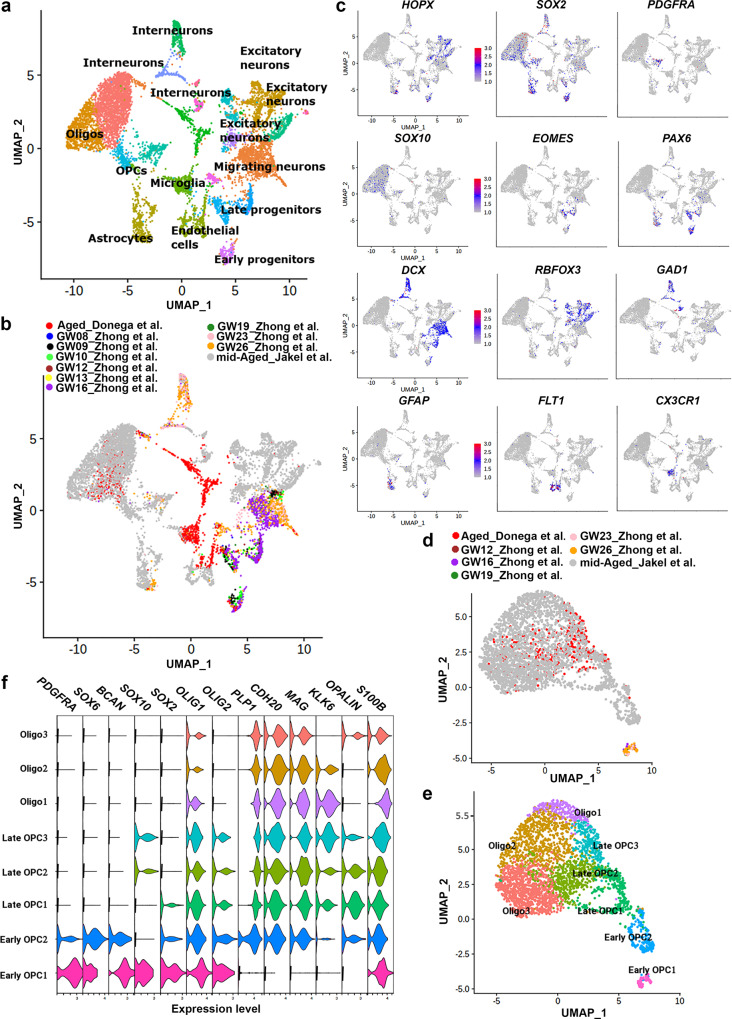
Fig. 2. CD271+ cells correspond to late OPCs and oligodendrocytes.
a, b UMAP projection of cell clusters shown by cell population (a) and origin of individual cells (b). c Feature plots for canonical markers of different cell populations. d, e UMAP projection of the origin of individual cells (d) and OPC lineage subclusters (e). f Violin plots of markers enriched in specific oligodendrocyte subpopulation. Gene expression level plotted as normalized counts. GW gestational weeks. (n = 3 donors; 2 females, aged 95 (504 cells) and 96 years (118 cells); 1 male, aged 72 years (116 cells)).

