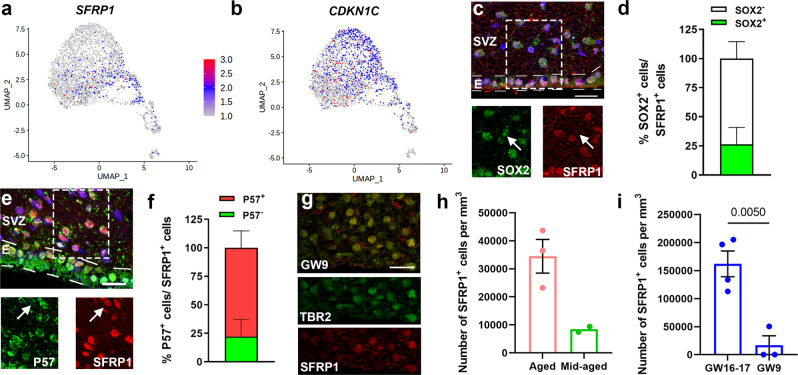
Fig. 4. Cell cycle inhibitors are expressed in the aged human SVZ.
a, b Feature plot showing the expression of CDKN1C (P57) (a) and SFRP1 (b) (n = 3 donors; 2 females, aged 95 (504 cells) and 96 years (118 cells); 1 male, aged 72 years (116 cells)). c Representative image of SFRP1+ progenitors in the aged human SVZ. d Quantification of the percentage of SFRP1+ cells that express the stem cell marker SOX2 (n = 3 donors). e Representative image of SFRP1+ and P57+ cells in the aged human SVZ. f Quantification of the proportion of SFRP1+ cells that express P57 (n = 3 donors). g Representative images of SFRP1+ cells in the germinal region of the fetal human brain at GW9 co-expressing TBR2. h Quantification of SFRP1+ cells in the SVZ of aged (n = 3 donors; 2 females aged 92 and 99 years, 1 male aged 82 years) and mid-aged (n = 2 donors; 2 females aged 62 and 50 years) post-mortem brain tissue. i Quantification of SFRP1+ cells in the SVZ of GW9 (n = 3 donors; 2 females, 1 male) and GW16-17 (n = 4 donors; 2 females, 2 males) post-mortem brain tissue. Data represented as mean ± SEM when n > 2. Data represented as mean when n = 2. Two-tailed Unpaired Student’s t test. Hoechst was used as a nuclear counterstaining. E ependymal layer, GW gestational weeks. Scale bar = 20 µm. Source data are provided as a Source Data file.

