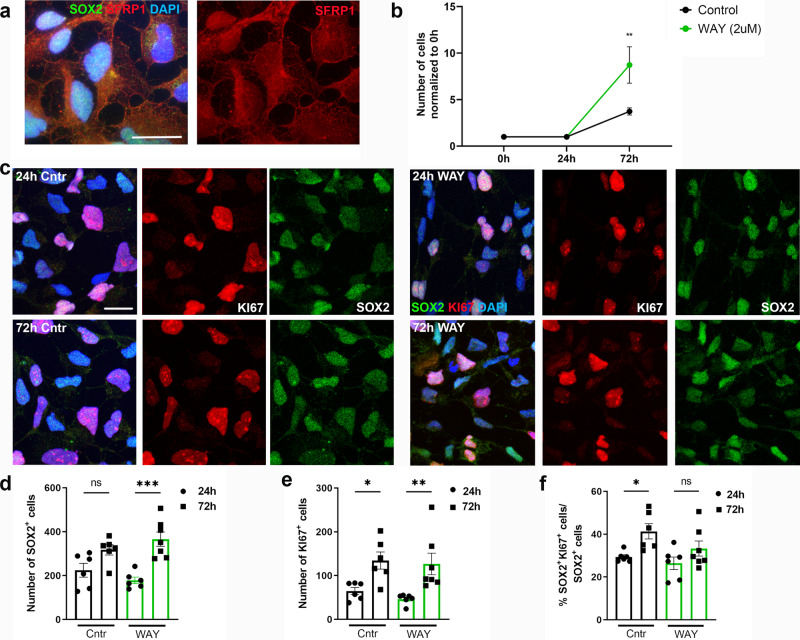
Fig. 5. Stimulation of proliferation in iPSC-derived NSCs by inhibition of SFRP1.
a Representative image of SFRP1+ iPSC-derived NSCs showing both nuclear and cytoplasmic labeling. b Quantification of the number of cells in control and stimulated condition over time (n = 3 biological replicates), **P = 0.0029, two-way ANOVA with Sidák multiple comparisons test. c Representative images of SOX2+KI67+ iPSC-derived NSCs. d–f Quantification of the number of SOX2+ cells (n = 6 images per condition), ns = 0.0529, ***P = 0.0001 (d), KI67+, *P = 0.0218, **P = 0.0061 (e) and, percentage of proliferating SOX2+ cells, *P = 0.0358, ns = 0.3093 (f). Data presented as mean ± SEM. One-way ANOVA with Sidák multiple comparisons test. ns not significant, Cntr control, h hour. Scale bar = 20 µm. Source data are provided as a Source Data file.

