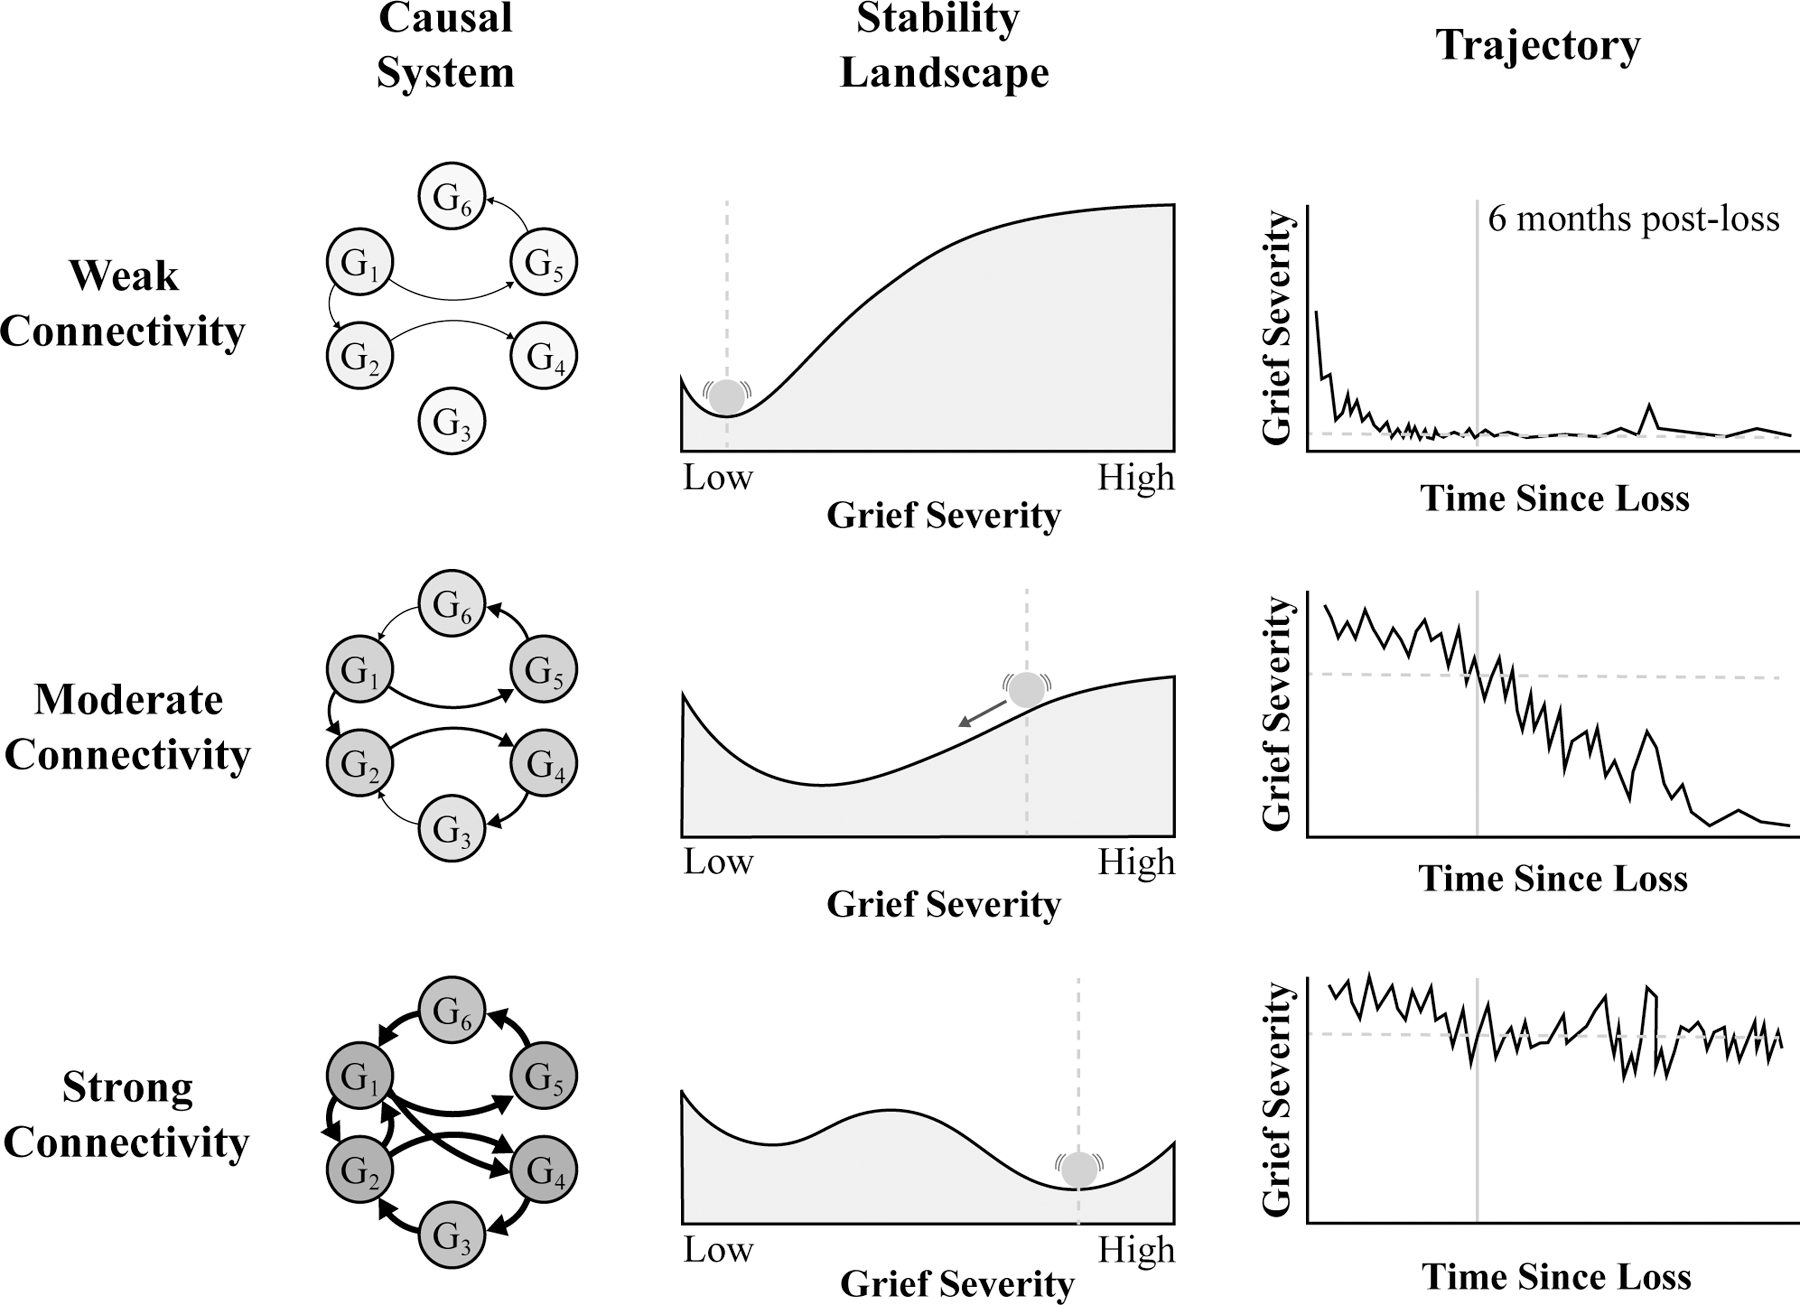
Figure 1. The Network (or Causal Systems) Theory of Prolonged Grief.

Note. The network theory of prolonged grief posits that causal interactions among the components of grief (G) lead them to persist over time. This figure depicts the structure of three different causal systems (left column) and the stability landscapes (middle column) and trajectories of response (right column) that follow from those systems. In each causal system, grief components are represented as nodes and the causal effects between them are represented as arrows between the nodes. Darker nodes signify greater severity of that component of grief at 6-months post-loss. Thicker arrows signify stronger causal effects. The stability landscapes provide a visualization of the system’s dynamics. In each landscape, the x-axis represents grief severity. The ball on top of the landscape indicates the current level of grief severity (in this case, at 6 months post-loss). The further along the x-axis, the greater one’s grief severity. The topography of the landscape along the y-axis describes the rate of change in grief severity over time. The steeper the landscape, the greater the rate of change. Where the landscape is flat (e.g., in the basins of the landscape) the rate of change is zero. In the absence of perturbations, the ball will always move ‘downhill’ into the nearest basin, where it will remain. For that reason, the basins in the landscape are also referred to as ‘stable states:’ states the system will move toward following perturbation. In a weakly-connected system, there is a single basin in the landscape located at a low level of grief severity. Bereavement may perturb the system, pushing it toward a higher level of grief. However, as bereavement becomes less proximal, its effect on the system dissipates and the system returns to a stable state of low grief severity. In a moderately-connected system, there are more and stronger causal relationships among components of grief. Here, the stability landscape is shallower, signifying a slower rate of change. Consequently, the system takes longer to recover from bereavement (see trajectory plot). However, because there is still only a single stable state of low grief severity, the system will eventually return to that stable state. Finally, in a strongly-connected system, causal relationships are sufficiently strong that the system can become self-perpetuating. This is reflected in the stability landscape by the formation of a new basin: an alternative stable state of high grief severity in which the system can fall. If bereavement is sufficient to push the system beyond the tipping point in the landscape, the causal relationships among the symptoms of grief will lead the system to remain in a stable state of high grief symptoms that does not remit with time (see trajectory plot). In a precisely-defined system, the stability landscapes can be calculated and the presence and location of stable states in the system can be determined. Here, the stability landscapes are used simply as a metaphor to illustrate how the structure of a causal system shapes the systems dynamics and, in turn, the trajectory of its response to bereavement. For further discussion of the relationship between causal system structure and the trajectory of response to bereavement, see Malgaroli, Maccallum, and Bonano’s work on computational approaches to grief in this issue [5].
