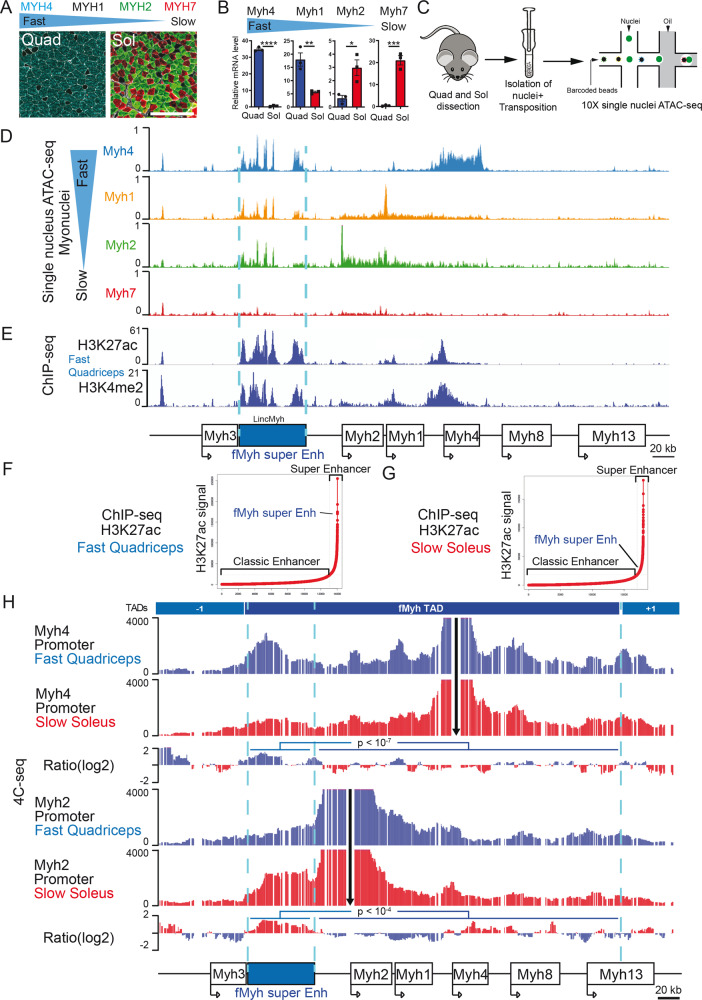
Fig. 1. Identification of a super enhancer in the intergenic region of Myh3 and Myh2.
A Adult myofibers express different MYH isoforms. Immunostaining against fast (MYH4, MYH2) and slow (MYH7) MYH of adult fast quadriceps (Quad) and slow soleus (Sol) muscle sections, MYH1 + myofibers by default appear black. B Quantification by RT-qPCR of Myh mRNA expression in adult Quad and Sol (n = 3). C Graphical scheme of the experiments used for snATAC-seq experiments performed with slow soleus and fast quadriceps adult skeletal muscle. D Chromatin accessibility of the different types of myonuclei in the fast Myh locus. In fast myonuclei, we identified a 42-kb region with multiple chromatin accessibility peaks in the intergenic region of Myh3 and Myh2 genes. In slow Myh7 myonuclei this region of chromatin is not accessible. E H3K27Ac and H3K4me2 ChIP-seq signals25 were highly enriched in the 42 kb region of snATAC-seq peaks in the intergenic region of Myh3 and Myh2 genes. F Distribution of H3K27ac ChIP-seq signals across quadriceps and soleus enhancers25. SEs contain high amounts of H3K27ac and the fMyh 42 kb sequence is identified as a SE. G Same as F in soleus. H 4C-seq experiments showing the interactions of the Myh4 (up) and Myh2 (down) promoters in quadriceps (blue) and soleus (red). Viewpoints are indicated by black arrows. The Ratio of interactions between the quadriceps and the soleus is indicated in between and shows that promoters of the active gene at the locus display significantly more interactions within the 42 kb cis-regulatory fMyh super enhancer. Significance of difference: G-test. For B, significance of difference by Student t test. Numerical data are presented as mean ± s.e.m. *P < 0.05, **P < 0.01, ***P < 0.001, ****P < 0.0001. Scale bars: 100 μm for A. Source data are provided as a Source Data file.

