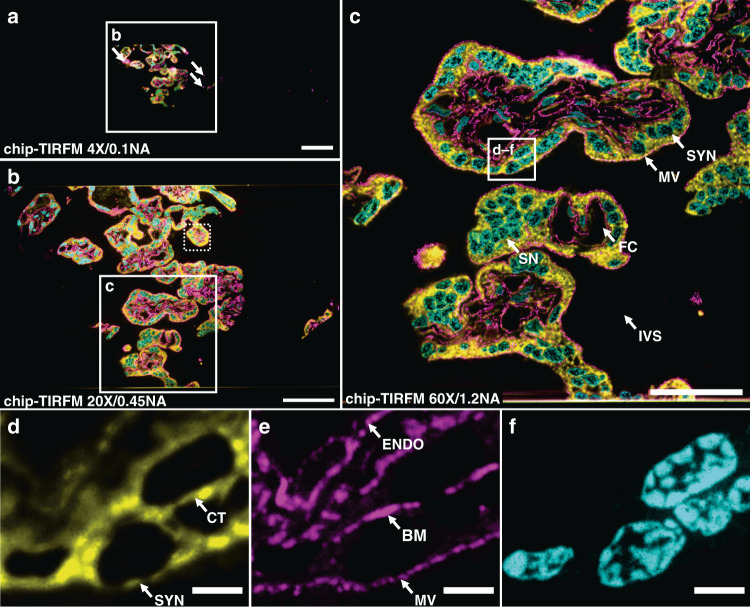
Fig. 2. Chip-based multicolor TIRFM imaging of a 400 nm placental tissue section prepared by Tokuyasu method.
Membranes labeled with CellMask Deep Red (pseudo-colored in yellow), F-actin labeled with Phalloidin-Atto565 (pseudo-colored in magenta), and nuclei labeled with Sytox Green (pseudo-colored in cyan). a Large field of view chip-based multicolor TIRFM image acquired with a 4X/0.1NA microscope objective. The white arrows indicate the locations of unspecific binding of the F-actin marker to the waveguide. The white box represents the area imaged with a higher magnification objective lens in (b). b Chip-based multicolor TIRFM image acquired with a 20X/0.45NA microscope objective. The white box represents the area subsequently imaged with a higher magnification objective lens in (c). The white-dotted box illustrates the maximum field of view (50 µm × 50 µm) attainable in a conventional TIRFM setup. c Multicolor chip-TIRFM image acquired with a 60X/1.2NA microscope objective allows the identification of morphologically relevant structures of the chorionic villi such as the syncytiotrophoblastic cells (SYN), fetal capillaries (FC), syncytial knots (SN), and intervillous space (IVS) without maternal red blood cells due to thorough rinsing during sample preparation. The white box corresponds to the individual channels magnified in (d–f). d A magnified view of the membrane signal allows the distinction between a SYN and a cytotrophoblastic cell (CT). e A magnified view of the F-actin signal conforms to the expected location for this marker, in places such as the microvilli brush border (MV), the SYN’s basal membrane (BM), and the capillary endothelial cell (ENDO). f Magnified view of syncytial and cytotrophoblast nuclei. Scale bars a 200 µm, b 100 µm, c 50 µm, d, e 5 µm

