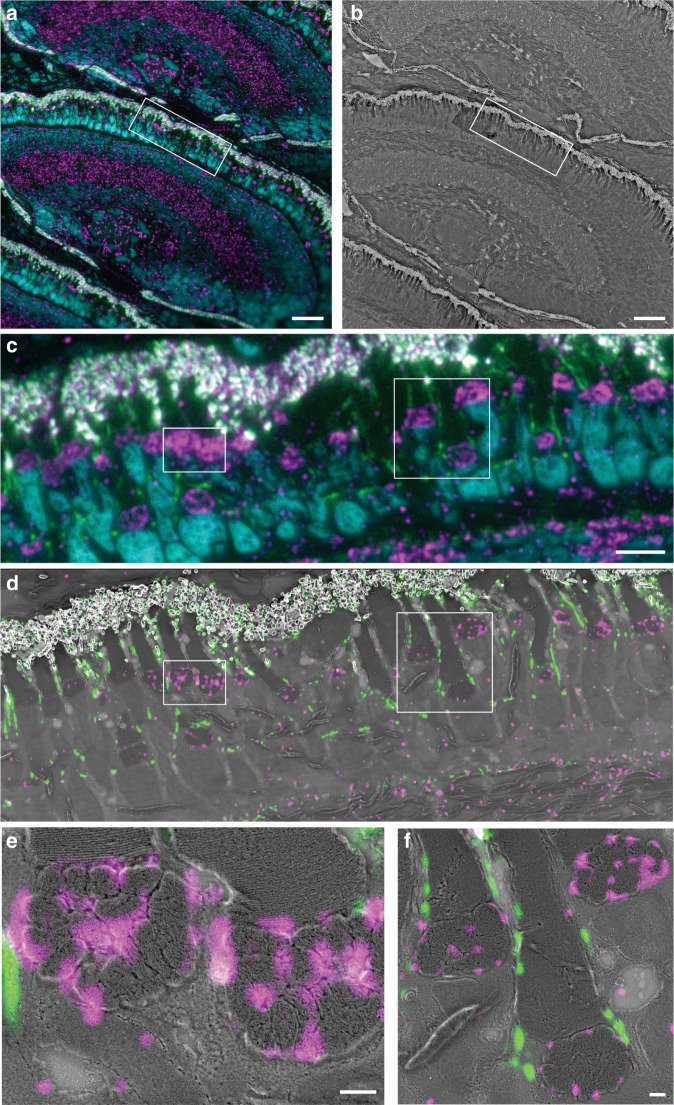
Fig. 5. Chip-based CLEM imaging of a 110 nm thick zebrafish retina cryosection prepared by Tokuyasu method on a 600 µm wide optical waveguide.
a Diffraction-limited chip-TIRFM image. In magenta, mitochondrial clusters immunolabeled with rabbit anti-Tomm20 protein (primary antibody) and Alexa Fluor 647-conjugated donkey anti-rabbit (secondary antibody). In green, actin segments labeled with Texas Red-X Phalloidin. In cyan, nuclei labeled with Sytox Green. b Scanning electron microscope image of the same region shown in (a) scanned at 30 nm pixel size. c high-magnification image of the white frame in (a) showing the diffraction-limited chip-TIRFM signal of mitochondria, actin, and nuclei. d CLEM image of areas in frames (a) and (b). Scanning electron microscope image acquired at 4 nm pixel size correlates with the MUSICAL images of mitochondria (magenta) and actin (green). e CLEM image of the white region in (d). MUSICAL image of the Tomm20 signal (magenta) in the outer membrane of mitochondria correlating with the morphology of the complex clusters of mitochondria. The tightly packed membranes of the outer segment are clearly recognized. f CLEM image of MUSICAL-processed actin signal along with the outer segments (green) and three mitochondria clusters. The MUSICAL signal in (d–f) were gamma-corrected to increase the contrast of the actin (γ = 1.2) and the Tomm20 signal (γ = 1.1). Scale bars a, b 20 µm, c, d 5 µm, e, f 500 nm

