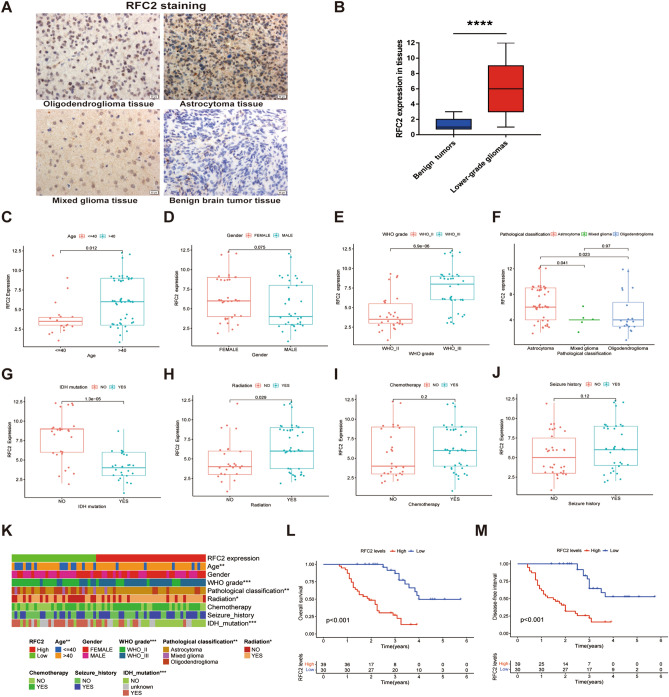
Figure 11.
RFC2 expression correlated with clinicopathological features in our LGG samples. (A) The immunohistochemistry images showing the relative expression of RFC2 in LGG tissues and benign brain tumor tissues (Original magnification, × 400). (B) RFC2 expression levels in LGG tissues (n = 69) and benign brain tumor tissues (n = 10) were evaluated by immunohistochemistry analysis. (C–J) The associations of RFC2 expression with clinicopathological factors, including age (C), gender (D), WHO grade (E), pathological classification (F), IDH1 mutation status (G), radiation therapy history (H), chemotherapy history (I), and seizure history (J). (K) Heatmap displaying the correlation between RFC2 expression and clinicopathological features in our LGG patients. (L,M) Kaplan–Meier survival analyses showing the relationships of RFC2 expression with overall survival (OS) (L) and disease-free survival (DFS) (M) in LGG patients. (*P < 0.05, **P < 0.01, ***P < 0.001, ****P < 0.0001).

